Kraft 2005 Annual Report Download - page 32
Download and view the complete annual report
Please find page 32 of the 2005 Kraft annual report below. You can navigate through the pages in the report by either clicking on the pages listed below, or by using the keyword search tool below to find specific information within the annual report.-
 1
1 -
2
-
3
-
4
-
5
-
6
-
7
-
8
-
9
-
10
-
11
-
12
-
13
-
14
-
15
-
16
-
17
-
18
-
19
-
20
-
21
-
 22
22 -
 23
23 -
 24
24 -
 25
25 -
 26
26 -
 27
27 -
 28
28 -
 29
29 -
 30
30 -
 31
31 -
 32
32 -
 33
33 -
 34
34 -
 35
35 -
 36
36 -
 37
37 -
 38
38 -
 39
39 -
 40
40 -
 41
41 -
 42
42 -
43
-
44
-
45
-
46
-
47
-
48
-
49
-
50
-
51
-
52
-
53
-
54
-
55
-
56
-
57
-
58
-
59
-
60
-
61
-
62
-
63
-
64
-
65
-
66
-
67
-
68
-
69
-
70
-
71
-
72
-
73
-
74
-
75
-
76
-
77
-
78
-
79
-
80
-
81
-
82
-
83
-
84
-
85
-
86
-
87
-
88
-
89
-
90
-
91
-
92
-
93
-
94
-
95
-
96
-
97
-
98
-
99
-
100
 |
 |
MERRILL CORPORATION ABLIJDE// 7-MAR-06 14:42 DISK126:[06CHI5.06CHI1135]DK1135A.;21
mrll.fmt Free: 1325DM/0D Foot: 0D/ 0D VJ RSeq: 2 Clr: 0
DISK024:[PAGER.PSTYLES]UNIVERSAL.BST;51
KRAFT FOODS-FSC CERTIFIED-10K/AR Proj: P1102CHI06 Job: 06CHI1135 File: DK1135A.;21
Merrill Corporation/Chicago (312) 786-6300 Page Dim: 8.250 X 10.750Copy Dim: 38. X 54.3
Operating income was affected by the following items during 2005, 2004 and 2003:
•Asset impairment, exit and implementation costs—As discussed in Note 3 to the consolidated
financial statements, during 2005 and 2004, the Company recorded $479 million and
$603 million, respectively, of asset impairment and exit costs on its consolidated statement of
earnings. Additionally, during 2005 and 2004, the Company recorded pre-tax implementation
costs of $87 million and $50 million, respectively. During 2004, the Company also recorded
$47 million of pre-tax impairment charges related to its equity investment in a joint venture in
Turkey.
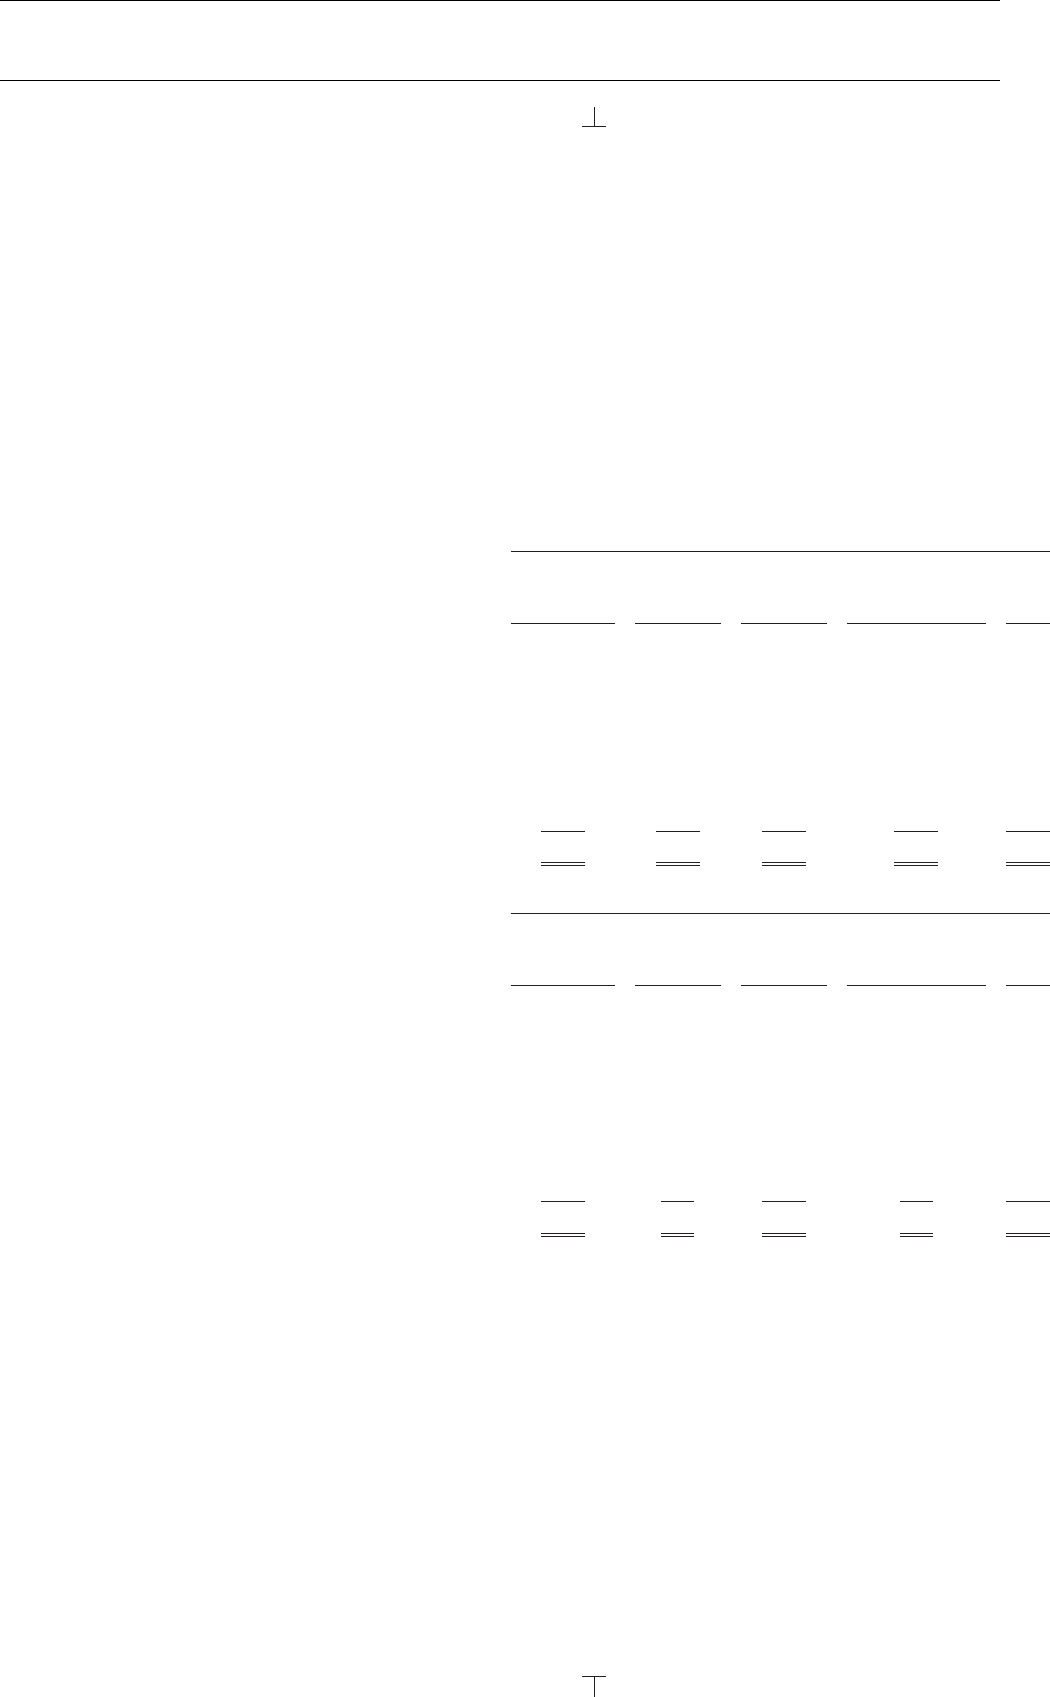
The pre-tax asset impairment, exit and implementation costs for the years ended December 31,
2005 and 2004, were included in the operating companies income of the following segments:
For the Year Ended December 31, 2005
Total Asset
Impairment
Restructuring Asset and Implementation
Costs Impairment Exit Costs Costs Total
(in millions)
U.S. Beverages ................. $ 9 $ — $ 9 $ 2 $ 11
U.S. Cheese, Canada & North America
Foodservice .................. 33 113 146 20 166
U.S. Convenient Meals ............ 12 12 7 19
U.S. Grocery ................... 6 93 99 2 101
U.S. Snacks & Cereals ............ 6 63 69 24 93
Europe, Middle East & Africa ....... 127 127 26 153
Latin America & Asia Pacific ........ 17 17 6 23
Total—Continuing Operations ....... $210 $269 $479 $ 87 $566
For the Year Ended December 31, 2004
Total Asset Equity Impairment
Impairment and
Restructuring Asset and Implementation
Costs Impairment Exit Costs Costs Total
(in millions)
U.S. Beverages ................. $ 9 $— $ 9 $ 4 $ 13
U.S. Cheese, Canada & North America
Foodservice .................. 103 8 111 8 119
U.S. Convenient Meals ............ 41 41 4 45
U.S. Grocery ................... 8 8 6 14
U.S. Snacks & Cereals ............ 222 222 18 240
Europe, Middle East & Africa ....... 180 180 56 236
Latin America & Asia Pacific ........ 20 12 32 1 33
Total—Continuing Operations ....... $583 $20 $603 $97 $700
31
6 C Cs: 50674