Kraft 2005 Annual Report Download - page 37
Download and view the complete annual report
Please find page 37 of the 2005 Kraft annual report below. You can navigate through the pages in the report by either clicking on the pages listed below, or by using the keyword search tool below to find specific information within the annual report.-
 1
1 -
2
-
3
-
4
-
5
-
6
-
7
-
8
-
9
-
10
-
11
-
12
-
13
-
14
-
15
-
16
-
17
-
18
-
19
-
20
-
21
-
22
-
23
-
24
-
25
-
26
-
 27
27 -
 28
28 -
 29
29 -
 30
30 -
 31
31 -
 32
32 -
 33
33 -
 34
34 -
 35
35 -
 36
36 -
 37
37 -
 38
38 -
 39
39 -
 40
40 -
 41
41 -
 42
42 -
 43
43 -
 44
44 -
 45
45 -
 46
46 -
 47
47 -
48
-
49
-
50
-
51
-
52
-
53
-
54
-
55
-
56
-
57
-
58
-
59
-
60
-
61
-
62
-
63
-
64
-
65
-
66
-
67
-
68
-
69
-
70
-
71
-
72
-
73
-
74
-
75
-
76
-
77
-
78
-
79
-
80
-
81
-
82
-
83
-
84
-
85
-
86
-
87
-
88
-
89
-
90
-
91
-
92
-
93
-
94
-
95
-
96
-
97
-
98
-
99
-
100
 |
 |

MERRILL CORPORATION ABLIJDE// 7-MAR-06 14:42 DISK126:[06CHI5.06CHI1135]DK1135A.;21
mrll.fmt Free: 110D*/120D Foot: 0D/ 0D VJ RSeq: 7 Clr: 0
DISK024:[PAGER.PSTYLES]UNIVERSAL.BST;51
KRAFT FOODS-FSC CERTIFIED-10K/AR Proj: P1102CHI06 Job: 06CHI1135 File: DK1135A.;21
Merrill Corporation/Chicago (312) 786-6300 Page Dim: 8.250 X 10.750Copy Dim: 38. X 54.3
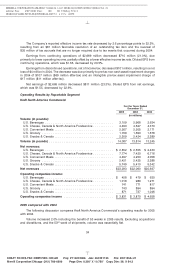
the divestiture of the yogurt assets. In foodservice, net revenues increased, due primarily to favorable
currency and the impact of the 2004 Veryfine acquisition.
Operating companies income increased $29 million (2.9%), due primarily to higher pricing and
favorable costs ($78 million, net of higher promotional spending), favorable volume/mix ($68 million
including the benefit of the 53rd week) and favorable currency ($31 million), partially offset by higher
marketing, administration and research costs ($72 million, including higher benefit costs, as well as
costs associated with the 53rd week), the impact of higher asset impairment and exit costs ($35 million),
higher fixed manufacturing costs ($28 million) and higher implementation costs associated with the
restructuring program ($12 million).
U.S. Convenient Meals. Volume increased 2.8% including the 53rd week of shipments
(approximately 2 percentage points of growth), due primarily to higher shipments in meats, pizza and
meals. Meats volume increased, aided by higher shipments of cold cuts and new product introductions.
Meals volume increased, due primarily to the impact of the 53rd week, partially offset by the
discontinuation of a product line. In pizza, volume also increased due primarily to the 53rd week and new
product introductions, partially offset by competitive activity.
Net revenues increased $247 million (5.8%), due to higher volume/mix ($227 million, including the
benefit of the 53rdweek) and higher pricing, net of increased promotional spending ($20 million,
reflecting commodity-driven pricing in meats and pizza). Meats net revenues increased, due primarily to
higher volume and commodity-driven price increases, partially offset by higher promotional spending.
Pizza net revenues increased, driven by positive mix from new products and the impact of commodity-
driven price increases. In meals, net revenues increased due primarily to improved mix from new
products, partially offset by the discontinuation of a product line and increased promotional spending.
Operating companies income decreased $30 million (3.9%), due primarily to higher marketing,
administration and research costs ($77 million, including higher marketing and benefit costs, as well as
costs associated with the 53rd week) and higher fixed manufacturing expenses ($30 million), partially
offset by favorable volume/mix ($45 million including the benefit of the 53rd week), lower pre-tax charges
for asset impairment and exit costs ($29 million) and higher pricing net of higher costs ($8 million, due
primarily to higher commodity driven pricing).
U.S. Grocery. Volume increased 1.1% due to the 53rd week of shipments (approximately
2 percentage points of growth). Enhancers volume increased slightly due primarily to higher shipments
of spoonable dressings, partially offset by lower volume in pourable dressings and barbecue sauce due
to increased competitive activity. In desserts, volume increased aided by new product introductions in
refrigerated ready-to-eat desserts, partially offset by declines in dry packaged desserts and the impact of
the fruit snacks divestiture.
Net revenues decreased $4 million (0.2%), due primarily to the impact of divestitures ($30 million),
partially offset by higher volume/mix ($20 million, including the benefit of the 53rd week) and higher
pricing, net of increased promotional spending ($5 million). Desserts net revenues decreased, due
primarily to the impact of the fruit snacks divestiture and declines in dry packaged desserts, partially
offset by new product introductions in refrigerated ready-to-eat desserts and gains in marshmallows.
Operating companies income decreased $151 million (16.9%), due primarily to higher pre-tax
charges for asset impairment and exit costs ($91 million), unfavorable costs, net of higher pricing
($31 million, due primarily to higher commodity costs and increased promotional spending), higher
marketing, administration and research costs ($21 million, including higher benefit costs, as well as
costs associated with the 53rd week) and higher fixed manufacturing costs ($10 million).
U.S. Snacks & Cereals. Volume increased 3.5% including the 53rd week of shipments
(approximately 2 percentage points of growth), as gains in biscuits and cereals were partially offset by a
decline in salted snacks. In biscuits, volume increased due primarily to new product introductions in
36
6 C Cs: 11862