Kraft 2005 Annual Report Download - page 44
Download and view the complete annual report
Please find page 44 of the 2005 Kraft annual report below. You can navigate through the pages in the report by either clicking on the pages listed below, or by using the keyword search tool below to find specific information within the annual report.-
 1
1 -
2
-
3
-
4
-
5
-
6
-
7
-
8
-
9
-
10
-
11
-
12
-
13
-
14
-
15
-
16
-
17
-
18
-
19
-
20
-
21
-
22
-
23
-
24
-
25
-
26
-
27
-
28
-
29
-
30
-
31
-
32
-
33
-
 34
34 -
 35
35 -
 36
36 -
 37
37 -
 38
38 -
 39
39 -
 40
40 -
 41
41 -
 42
42 -
 43
43 -
 44
44 -
 45
45 -
 46
46 -
 47
47 -
 48
48 -
 49
49 -
 50
50 -
 51
51 -
 52
52 -
 53
53 -
 54
54 -
55
-
56
-
57
-
58
-
59
-
60
-
61
-
62
-
63
-
64
-
65
-
66
-
67
-
68
-
69
-
70
-
71
-
72
-
73
-
74
-
75
-
76
-
77
-
78
-
79
-
80
-
81
-
82
-
83
-
84
-
85
-
86
-
87
-
88
-
89
-
90
-
91
-
92
-
93
-
94
-
95
-
96
-
97
-
98
-
99
-
100
 |
 |

MERRILL CORPORATION MBLOUNT// 9-MAR-06 12:42 DISK126:[06CHI5.06CHI1135]DM1135A.;12
mrll.fmt Free: 230D*/240D Foot: 0D/ 0D VJ RSeq: 2 Clr: 0
DISK024:[PAGER.PSTYLES]UNIVERSAL.BST;51
KRAFT FOODS-FSC CERTIFIED-10K/AR Proj: P1102CHI06 Job: 06CHI1135 File: DM1135A.;12
Merrill Corporation/Chicago (312) 786-6300 Page Dim: 8.250 X 10.750Copy Dim: 38. X 54.3
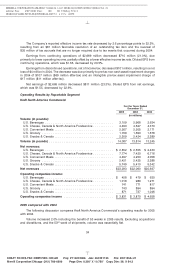
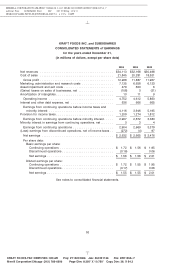
Operating companies income decreased $141 million (36.1%), due primarily to higher marketing,
administration and research costs ($43 million), the 2004 pre-tax charges for asset impairment and exit
costs ($32 million), lower volume/mix ($25 million), unfavorable costs, net of higher pricing ($21 million,
including increased promotional spending), unfavorable currency ($9 million) and the 2004 pre-tax loss
on the sale of a snack nuts business in Brazil ($8 million).
Financial Review
Net Cash Provided by Operating Activities
Net cash provided by operating activities was $3.5 billion in 2005, $4.0 billion in 2004 and
$4.1 billion in 2003. The decrease in 2005 operating cash flows from 2004 was due primarily to an
increase in income tax payments (primarily related to the sale of the sugar confectionery business), an
increase in the use of cash to fund working capital, due primarily to an increase in cash payments
associated with the restructuring plan, and lower earnings, partially offset by lower pension plan
contributions. The decrease in 2004 operating cash flows from 2003 was due primarily to lower net
earnings, cash payments associated with the restructuring program and higher pension contributions,
partially offset by a lower use of cash to fund working capital.
Net Cash Provided by (Used in) Investing Activities
One element of the growth strategy of the Company is to strengthen its brand portfolios through
disciplined programs of selective acquisitions and divestitures. The Company is constantly reviewing
potential acquisition candidates and from time to time sells businesses to accelerate the shift in its
portfolio toward businesses—whether global, regional or local—that offer the Company a sustainable
competitive advantage. The impact of future acquisitions or divestitures could have a material impact on
the Company’s cash flows.
During 2005, net cash provided by investing activities was $525 million, compared with net cash
used in investing activities of $1.1 billion and $1.0 billion in 2004 and 2003, respectively. The cash
provided by investing activities in 2005 includes the proceeds from sales of businesses, including the
sugar confectionery business, fruit snacks assets, U.K. desserts assets, U.S. yogurt assets, a small
business in Colombia, a small equity investment in Turkey and a minor trademark in Mexico. The
increase in 2004 primarily reflected higher uses of cash for the purchase of businesses and the reduction
of cash received from the sales of businesses, partially offset by lower capital expenditures.
Capital expenditures, which were funded by operating activities, were $1.2 billion, $1.0 billion and
$1.1 billion in 2005, 2004 and 2003, respectively. The 2005 capital expenditures were primarily to
modernize manufacturing facilities, implement the restructuring program, and support new product and
productivity initiatives. In 2006, capital expenditures are currently expected to be flat to 2005
expenditures, including capital expenditures required for the restructuring program. These expenditures
are expected to be funded from operations.
Net Cash Used in Financing Activities
During 2005, net cash of $4.0 billion was used in financing activities, compared with $3.2 billion
during 2004. The increase in cash used in 2005 was due primarily to an increase in the Company’s
Class A share repurchases and the repayment of debt, partially offset by an increase in amounts due to
Altria Group, Inc. and affiliates.
During 2004, net cash of $3.2 billion was used in financing activities, compared with $2.8 billion
during 2003. The increase in cash used in 2004 was due primarily to an increase in the Company’s
Class A share repurchases and dividend payments. In November 2004, the Company issued
43
6 C Cs: 4007