Kraft 2005 Annual Report Download - page 33
Download and view the complete annual report
Please find page 33 of the 2005 Kraft annual report below. You can navigate through the pages in the report by either clicking on the pages listed below, or by using the keyword search tool below to find specific information within the annual report.-
 1
1 -
2
-
3
-
4
-
5
-
6
-
7
-
8
-
9
-
10
-
11
-
12
-
13
-
14
-
15
-
16
-
17
-
18
-
19
-
20
-
21
-
22
-
 23
23 -
 24
24 -
 25
25 -
 26
26 -
 27
27 -
 28
28 -
 29
29 -
 30
30 -
 31
31 -
 32
32 -
 33
33 -
 34
34 -
 35
35 -
 36
36 -
 37
37 -
 38
38 -
 39
39 -
 40
40 -
 41
41 -
 42
42 -
 43
43 -
44
-
45
-
46
-
47
-
48
-
49
-
50
-
51
-
52
-
53
-
54
-
55
-
56
-
57
-
58
-
59
-
60
-
61
-
62
-
63
-
64
-
65
-
66
-
67
-
68
-
69
-
70
-
71
-
72
-
73
-
74
-
75
-
76
-
77
-
78
-
79
-
80
-
81
-
82
-
83
-
84
-
85
-
86
-
87
-
88
-
89
-
90
-
91
-
92
-
93
-
94
-
95
-
96
-
97
-
98
-
99
-
100
 |
 |

MERRILL CORPORATION ABLIJDE// 7-MAR-06 14:42 DISK126:[06CHI5.06CHI1135]DK1135A.;21
mrll.fmt Free: 95D*/120D Foot: 0D/ 0D VJ RSeq: 3 Clr: 0
DISK024:[PAGER.PSTYLES]UNIVERSAL.BST;51
KRAFT FOODS-FSC CERTIFIED-10K/AR Proj: P1102CHI06 Job: 06CHI1135 File: DK1135A.;21
Merrill Corporation/Chicago (312) 786-6300 Page Dim: 8.250 X 10.750Copy Dim: 38. X 54.3
During 2003, the Company recorded a pre-tax charge of $6 million for asset impairment and exit
costs related to the closure of a Nordic snacks plant. This charge was included in the operating
companies income of the Europe, Middle East & Africa segment.
•(Gains) Losses on Sales of Businesses—During 2005, the Company sold its fruit snacks assets,
U.K. desserts assets, U.S. yogurt assets, a small business in Colombia, a minor trademark in
Mexico and a small equity investment in Turkey for aggregate pre-tax gains of $108 million. During
2004, the Company sold a Brazilian snack nuts business and trademarks associated with a candy
business in Norway for aggregate pre-tax losses of $3 million. During 2003, the Company sold a
European rice business and a branded fresh cheese business in Italy for aggregate pre-tax gains
of $31 million. These pre-tax (gains) losses were included in the operating companies income of
the following segments:
For the Years Ended
December 31,
2005 2004 2003
(in millions)
U.S. Cheese, Canada & North America Foodservice .............. $ (1) $— $—
U.S. Grocery .......................................... 2
Europe, Middle East & Africa .............................. (113) (5) (31)
Latin America & Asia Pacific ............................... 4 8
(Gains) losses on sales of businesses ........................ $(108) $ 3 $(31)
As discussed in Note 14 to the consolidated financial statements, the Company’s management
uses operating companies income, which is defined as operating income before general corporate
expenses and amortization of intangibles, to evaluate segment performance and allocate resources.
Management believes it is appropriate to disclose this measure to help investors analyze the business
performance and trends of the various business segments.
2005 compared with 2004
The following discussion compares consolidated operating results for 2005 with 2004.
The Company’s 2005 results included 53 weeks of operating results compared with 52 weeks in
2004. The Company estimates that this extra week positively impacted net revenues and operating
income by approximately 2% in 2005 (approximately $625 million and $100 million, respectively).
Volume increased 210 million pounds (1.1%), including the benefit of 53 weeks in 2005 results.
Excluding all acquisitions and divestitures, and the 53rd week of shipments, volume decreased
approximately 1% due primarily to a focus on mix improvement, a SKU reduction program, the impact of
higher retail prices on category growth trends in the United States and declines in certain international
countries (most notably Germany), partially offset by new product introductions and growth in
developing markets.
Net revenues increased $1,945 million (6.0%) due primarily to favorable volume/mix ($1,086 million,
including the benefit of the 53rd week), favorable currency ($533 million), higher net pricing ($453 million,
reflecting commodity-driven pricing, partially offset by increased promotional spending) and the impact
of acquisitions ($42 million), partially offset by the impact of divested businesses ($174 million).
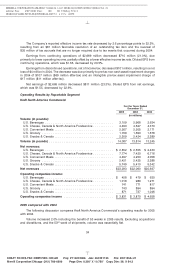
Operating income increased $140 million (3.0%), due primarily to favorable volume/mix
($479 million, including the benefit of the 53rd week), lower asset impairment and exit costs
($124 million), net gains on the sales of businesses ($111 million), favorable currency ($90 million) and a
2004 equity investment impairment charge related to a joint venture in Turkey ($47 million), partially
offset by higher marketing, administration and research costs ($420 million, including higher benefit and
marketing costs, as well as costs associated with the 53rd week), higher fixed manufacturing costs
32
6 C Cs: 30918