Kraft 2005 Annual Report Download - page 74
Download and view the complete annual report
Please find page 74 of the 2005 Kraft annual report below. You can navigate through the pages in the report by either clicking on the pages listed below, or by using the keyword search tool below to find specific information within the annual report.-
 1
1 -
2
-
3
-
4
-
5
-
6
-
7
-
8
-
9
-
10
-
11
-
12
-
13
-
14
-
15
-
16
-
17
-
18
-
19
-
20
-
21
-
22
-
23
-
24
-
25
-
26
-
27
-
28
-
29
-
30
-
31
-
32
-
33
-
34
-
35
-
36
-
37
-
38
-
39
-
40
-
41
-
42
-
43
-
44
-
45
-
46
-
47
-
48
-
49
-
50
-
51
-
52
-
53
-
54
-
55
-
56
-
57
-
58
-
59
-
60
-
61
-
62
-
63
-
 64
64 -
 65
65 -
 66
66 -
 67
67 -
 68
68 -
 69
69 -
 70
70 -
 71
71 -
 72
72 -
 73
73 -
 74
74 -
 75
75 -
 76
76 -
 77
77 -
 78
78 -
 79
79 -
 80
80 -
 81
81 -
 82
82 -
 83
83 -
 84
84 -
85
-
86
-
87
-
88
-
89
-
90
-
91
-
92
-
93
-
94
-
95
-
96
-
97
-
98
-
99
-
100
 |
 |

MERRILL CORPORATION ABLIJDE// 7-MAR-06 14:42 DISK126:[06CHI5.06CHI1135]DY1135A.;6
mrll.fmt Free: 40D*/240D Foot: 0D/ 0D VJ RSeq: 5 Clr: 0
DISK024:[PAGER.PSTYLES]UNIVERSAL.BST;51
KRAFT FOODS-FSC CERTIFIED-10K/AR Proj: P1102CHI06 Job: 06CHI1135 File: DY1135A.;6
Merrill Corporation/Chicago (312) 786-6300 Page Dim: 8.250 X 10.750Copy Dim: 38. X 54.3
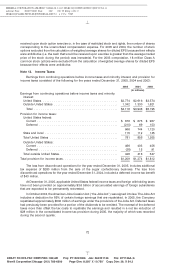
The Jobs Act also provides tax relief to U.S. domestic manufacturers by providing a tax deduction
related to a percentage of the lesser of ‘‘qualified production activities income’’ or taxable income. The
deduction, which was 3% in 2005, increases to 9% by 2010. In accordance with SFAS No. 109, the
Company will recognize these benefits in the year earned. The tax benefit in 2005 was approximately
$25 million.
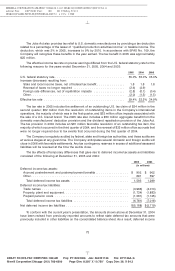
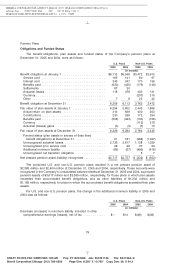
The effective income tax rate on pre-tax earnings differed from the U.S. federal statutory rate for the
following reasons for the years ended December 31, 2005, 2004 and 2003:
2005 2004 2003
U.S. federal statutory rate ...................................... 35.0% 35.0% 35.0%
Increase (decrease) resulting from:
State and local income taxes, net of federal tax benefit ............... 1.8 1.8 1.8
Reversal of taxes no longer required ............................ (2.6) (2.9)
Foreign rate differences, net of repatriation impacts ................. (2.8) (0.1) (0.4)
Other ................................................... (2.0) (1.5) (1.5)
Effective tax rate ............................................ 29.4% 32.3% 34.9%
The tax rate in 2005 includes the settlement of an outstanding U.S. tax claim of $24 million in the
second quarter; $82 million from the resolution of outstanding items in the Company’s international
operations, the majority of which was in the first quarter, and $33 million of tax impacts associated with
the sale of a U.S. biscuit brand. The 2005 rate also includes a $53 million aggregate benefit from the
domestic manufacturers’ deduction provision and the dividend repatriation provision of the Jobs Act.
The tax provision in 2004 includes an $81 million favorable resolution of an outstanding tax item, the
majority of which occurred in the third quarter of 2004, and the reversal of $35 million of tax accruals that
were no longer required due to tax events that occurred during the first quarter of 2004.
The Company is regularly audited by federal, state and foreign tax authorities, and these audits are
at various stages at any given time. The Company anticipates several domestic and foreign audits will
close in 2006 with favorable settlements. Any tax contingency reserves in excess of additional assessed
liabilities will be reversed at the time the audits close.
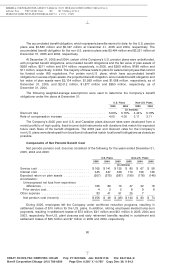
The tax effects of temporary differences that gave rise to deferred income tax assets and liabilities
consisted of the following at December 31, 2005 and 2004:
2005 2004
(in millions)
Deferred income tax assets:
Accrued postretirement and postemployment benefits .................. $ 902 $ 902
Other ..................................................... 691 397
Total deferred income tax assets ............................... 1,593 1,299
Deferred income tax liabilities:
Trade names ............................................... (3,966) (4,010)
Property, plant and equipment ................................... (1,734) (1,883)
Prepaid pension costs ........................................ (1,081) (1,125)
Total deferred income tax liabilities .............................. (6,781) (7,018)
Net deferred income tax liabilities .................................. $(5,188) $(5,719)
To conform with the current year’s presentation, the amounts shown above at December 31, 2004
have been revised from previously reported amounts to reflect state deferred tax amounts that were
previously included in other liabilities on the consolidated balance sheet. As a result, deferred income
73
6 C Cs: 11960