IHOP 2012 Annual Report Download - page 96
Download and view the complete annual report
Please find page 96 of the 2012 IHOP annual report below. You can navigate through the pages in the report by either clicking on the pages listed below, or by using the keyword search tool below to find specific information within the annual report.
DineEquity, Inc. and Subsidiaries
Notes to the Consolidated Financial Statements (Continued)
78
6. Goodwill
The significant majority of the Company's goodwill and other intangible assets arose from the November 29, 2007 acquisition
of Applebee's. As of December 31, 2012 and 2011, the balance of goodwill was $697.5 million, of which $686.7 million has been
allocated to the Applebee's franchise reporting unit and $10.8 million to the IHOP franchise reporting unit.
In accordance with U.S. GAAP, goodwill must be evaluated for impairment, at a minimum, on an annual basis, and more
frequently if the Company believes indicators of impairment exist. Such indicators include, but are not limited to, events or
circumstances such as a significant adverse change in the business climate, unanticipated competition, a loss of key personnel,
adverse legal or regulatory developments, or a significant decline in the market price of the Company's common stock. In the
process of the Company's annual impairment review, the Company primarily uses the income approach method of valuation that
utilizes a discounted cash flow model to estimate the fair value of its reporting units. Significant assumptions used to determine
fair value under the discounted cash flows model include future trends in sales, operating expenses, overhead expenses, depreciation,
capital expenditures, and changes in working capital, along with an appropriate discount rate.
During the fiscal years ended 2012 and 2011, the Company made periodic assessments as to whether there were indicators
of impairment, particularly with respect to the significant assumptions underlying the discounted cash flow model, and determined
an interim test of goodwill was not warranted. Accordingly, the Company performed a quantitative test of goodwill impairment
in the fourth quarter of 2012 and 2011. In the first step of each year's impairment test, the estimated fair value of both the IHOP
and Applebee's franchising units exceeded their respective carrying values and the Company concluded there was no impairment
of goodwill.
7. Other Intangible Assets
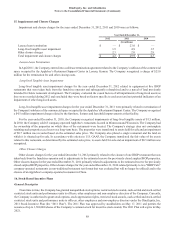
As of December 31, 2012 and 2011, intangible assets were as follows:
Not Subject to Amortization Subject to Amortization
Tradename Liquor
Licenses Other Franchising
Rights Recipes and
Menus Leaseholds Total
(In millions)
Balance, December 31, 2009...... $ 652.4 $ 2.9 $ 0.2 $ 179.5 $ 11.2 $ 3.4 $ 849.6
Amortization expense................. — — — (10.0) (2.3) (1.0) (13.3)
Impairment.................................. — (0.3) — — — — (0.3)
Refranchising.............................. — — — (0.2) — (1.2) (1.4)
Other ........................................... — — 0.1 — — 1.2 1.3
Balance, December 31, 2010...... 652.4 2.6 0.3 169.3 8.9 2.4 835.9
Amortization expense................. — — — (10.0) (2.3) (0.6) (12.9)
Refranchising.............................. — (1.1) — — — 0.3 (0.8)
Other ........................................... — — 0.2 — — — 0.2
Balance, December 31, 2011...... 652.4 1.5 0.5 159.3 6.6 2.1 822.4
Amortization expense................. — — — (10.0) (2.3) (0.2) (12.5)
Refranchising.............................. — (1.5) (0.1) (0.3) — (1.9) (3.8)
Balance, December 31, 2012...... $ 652.4 $ — $ 0.4 $ 149.0 $ 4.3 $ — $ 806.1
Annual amortization expense for the next five fiscal years is estimated to be approximately $10.9 million per year. The
weighted average life of the intangible assets subject to amortization is 19.0 and 18.8 years at December 31, 2012 and 2011,
respectively.
Gross and net carrying amounts of intangible assets subject to amortization at December 31, 2012 and 2011 are as follows:
December 31, 2012 December 31, 2011
Gross Accumulated
Amortization Net Gross Accumulated
Amortization Net
(In millions)
Franchising rights........................................ $ 200.0 $ (51.0) $ 149.0 $ 200.4 $ (41.1) $ 159.3
Recipes and menus...................................... 15.7 (11.4) 4.3 15.7 (9.1) 6.6
Leaseholds/other ......................................... 0.3 (0.3) — 4.7 (2.6) 2.1
Total.............................................................. $ 216.0 $ (62.7) $ 153.3 $ 220.8 $ (52.8) $ 168.0


