IHOP 2012 Annual Report Download - page 66
Download and view the complete annual report
Please find page 66 of the 2012 IHOP annual report below. You can navigate through the pages in the report by either clicking on the pages listed below, or by using the keyword search tool below to find specific information within the annual report.-
 1
1 -
2
-
3
-
4
-
5
-
6
-
7
-
8
-
9
-
10
-
11
-
12
-
13
-
14
-
15
-
16
-
17
-
18
-
19
-
20
-
21
-
22
-
23
-
24
-
25
-
26
-
27
-
28
-
29
-
30
-
31
-
32
-
33
-
34
-
35
-
36
-
37
-
38
-
39
-
40
-
41
-
42
-
43
-
44
-
45
-
46
-
47
-
48
-
49
-
50
-
51
-
52
-
53
-
54
-
55
-
 56
56 -
 57
57 -
 58
58 -
 59
59 -
 60
60 -
 61
61 -
 62
62 -
 63
63 -
 64
64 -
 65
65 -
 66
66 -
 67
67 -
 68
68 -
 69
69 -
 70
70 -
 71
71 -
 72
72 -
 73
73 -
 74
74 -
 75
75 -
 76
76 -
77
-
78
-
79
-
80
-
81
-
82
-
83
-
84
-
85
-
86
-
87
-
88
-
89
-
90
-
91
-
92
-
93
-
94
-
95
-
96
-
97
-
98
-
99
-
100
-
101
-
102
-
103
-
104
-
105
-
106
-
107
-
108
-
109
-
110
-
111
-
112
-
113
-
114
-
115
-
116
-
117
-
118
-
119
-
120
-
121
-
122
-
123
-
124
-
125
-
126
-
127
-
128
-
129
-
130
-
131
-
132
-
133
-
134
-
135
-
136
-
137
-
138
-
139
-
140
 |
 |

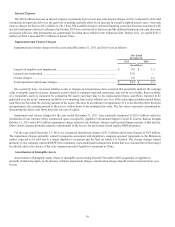
48
Favorable (Unfavorable)
Year Ended Components of Total Variance
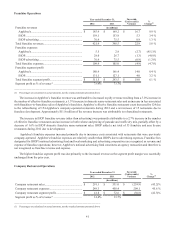
Applebee's Company-Operated Expenses December 31, Total Refranchising Current
As Percentage of Restaurant Sales 2011 2010 Variance and Closures Restaurants
Revenue............................................................ 100.0% 100.0%
Food and beverage ........................................... 25.7% 25.5% (0.2)% 0.0% (0.2)%
Labor ................................................................ 32.7% 33.2% 0.5 % 1.1% (0.6)%
Direct and occupancy....................................... 27.1% 26.6% (0.6)% 0.0% (0.5)%
Restaurant operating profit margin(1)................ 14.5% 14.8% (0.3)% 1.1% (1.4)%
_________________________________________
(1) Percentages may not add due to rounding.
The restaurant refranchising and closures noted above had a net favorable impact of 1.1% on restaurant operating profit
margin, primarily because the markets refranchised had higher-than-average labor costs. In terms of specific cost categories at
currently operating company restaurants:
• Food and beverage costs as a percentage of company restaurant sales increased 0.2%, primarily due to a 3.2% increase
in overall commodity costs (primarily produce, poultry, seafood and dairy) as well as menu changes, partially offset by
improvement in waste variances and savings associated with distribution center realignment.
• Labor costs as a percentage of restaurant sales increased 0.6% due to higher payroll-related costs, increased management
staffing levels and salaries, partially offset by decreased use of hourly shift supervisors and lower bonus costs. Payroll-
related costs increased because of the expiration of Hire Act FICA credits along with higher costs of workers compensation
insurance and hourly vacation expense.
• Direct and occupancy costs as a percentage of company restaurant sales increased 0.5% due to incremental investment
in local advertising, higher rates for both natural gas and electricity and higher facilities expenses.
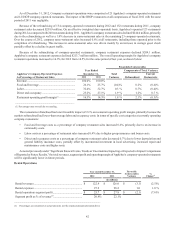
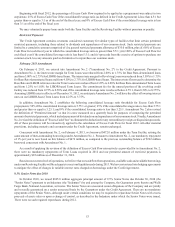
Rental Operations
Year ended December 31, Favorable
(Unfavorable)
Variance %
Change(1)
2011 2010
(In millions)
Rental revenues ................................................................... $ 126.0 $ 124.5 $ 1.5 1.2%
Rental expenses ................................................................... 98.2 99.0 0.8 0.9%
Rental operations segment profit......................................... $ 27.8 $ 25.5 $ 2.3 9.2%
Segment profit as % of revenue(1)........................................ 22.1% 20.5%
____________________________________________________________
(1) Percentages are calculated on actual amounts, not the rounded amounts presented above
Rental operations relate primarily to IHOP restaurants. Rental revenue includes income from operating leases and interest
income from direct financing leases. Rental expenses are costs of prime operating leases and interest expense on prime capital
leases on franchisee-operated restaurants.
Rental segment profit increased by $2.3 million primarily due to charges related to a franchisee default in 2010 that did not
recur in 2011. Segment profit in 2010 was adversely impacted by $5.7 million because of the write-off of deferred lease costs
associated with 21 of the 40 franchise restaurants operated by a former franchise operator that defaulted on its obligations in the
fourth quarter of 2010. This favorable effect on the comparison of 2011 with 2010 was partially offset by lower rent on refranchised
properties and the unfavorable impact on sales-based rent of the 2.0% decline in IHOP's domestic franchise same-restaurant sales
in 2011.