IHOP 2012 Annual Report Download - page 61
Download and view the complete annual report
Please find page 61 of the 2012 IHOP annual report below. You can navigate through the pages in the report by either clicking on the pages listed below, or by using the keyword search tool below to find specific information within the annual report.-
 1
1 -
2
-
3
-
4
-
5
-
6
-
7
-
8
-
9
-
10
-
11
-
12
-
13
-
14
-
15
-
16
-
17
-
18
-
19
-
20
-
21
-
22
-
23
-
24
-
25
-
26
-
27
-
28
-
29
-
30
-
31
-
32
-
33
-
34
-
35
-
36
-
37
-
38
-
39
-
40
-
41
-
42
-
43
-
44
-
45
-
46
-
47
-
48
-
49
-
50
-
 51
51 -
 52
52 -
 53
53 -
 54
54 -
 55
55 -
 56
56 -
 57
57 -
 58
58 -
 59
59 -
 60
60 -
 61
61 -
 62
62 -
 63
63 -
 64
64 -
 65
65 -
 66
66 -
 67
67 -
 68
68 -
 69
69 -
 70
70 -
 71
71 -
72
-
73
-
74
-
75
-
76
-
77
-
78
-
79
-
80
-
81
-
82
-
83
-
84
-
85
-
86
-
87
-
88
-
89
-
90
-
91
-
92
-
93
-
94
-
95
-
96
-
97
-
98
-
99
-
100
-
101
-
102
-
103
-
104
-
105
-
106
-
107
-
108
-
109
-
110
-
111
-
112
-
113
-
114
-
115
-
116
-
117
-
118
-
119
-
120
-
121
-
122
-
123
-
124
-
125
-
126
-
127
-
128
-
129
-
130
-
131
-
132
-
133
-
134
-
135
-
136
-
137
-
138
-
139
-
140
 |
 |

43
Rental operations relate primarily to IHOP franchise restaurants that were developed under the Previous Business Model
described under "Item 1. - Business - Restaurant Concepts - IHOP - Franchising." Rental revenue includes income from operating
leases and interest income from direct financing leases. Rental expenses are costs of prime operating leases and interest expense
on prime capital leases on franchisee-operated restaurants.
Rental revenue declined due to the write-off of deferred lease rental revenue associated with franchise restaurants whose lease
agreements were prematurely terminated, a decline in operating lease revenue from restaurants taken back from franchisees and
temporarily operated by the Company or closed, and a normal, progressive decline in interest income as direct financing leases
are repaid. Rental expenses declined due to the normal, progressive decline in interest expense as capital lease obligations are
repaid.
Rental segment profit decreased by $2.1 million primarily due to the write-off of deferred lease rental revenue associated with
franchise restaurants whose lease agreements were prematurely terminated.
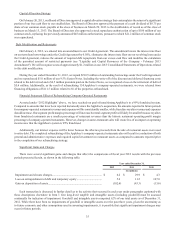
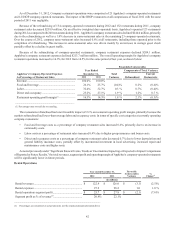
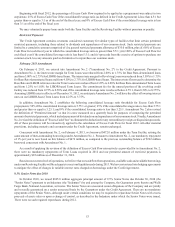
Financing Operations
Year ended December 31 Favorable
(Unfavorable)
Variance %
Change(1)
2012 2011
(In millions)
Financing revenues.............................................................. $ 14.5 $ 19.7 $ (5.2) (26.5)%
Financing expenses.............................................................. 1.6 6.0 4.4 72.8 %
Financing operations segment profit ................................... $ 12.9 $ 13.7 $ (0.8) (6.4)%
Segment profit as % of revenue(1) .................................................. 88.8% 69.7%
____________________________________________________________
(1) Percentages are calculated on actual amounts, not the rounded amounts presented above
Financing operations relate relate primarily to IHOP franchise restaurants that were developed under the Previous Business
Model described under "Item 1. - Business - Restaurant Concepts - IHOP - Franchising." Financing operations revenue primarily
consists of interest income from the financing of franchise fees and equipment leases, as well as sales of equipment associated
with refranchised IHOP restaurants. Financing expenses are primarily the cost of restaurant equipment.
The variance in both revenue and expense is primarily related to a 2011 transaction in which 40 restaurants operated by a
former franchisee that defaulted on its obligations under the franchise agreement were refranchised to an existing IHOP franchisee.
Certain equipment related to the refranchised restaurants was sold to the new operator. Financing revenues and expenses for the
year ended December 31, 2011 included $5.9 million of revenue and $6.0 million of costs related to equipment sales, of which
$5.0 million and $5.2 million, respectively, related to that single equipment sale. Financing revenues and expenses for the year
ended December 31, 2012 included $1.6 million related to several individually insignificant equipment and franchise sales. There
was also a $1.0 million decrease in interest revenue due to the progressive decline in note balances due to repayments.
The decline in financing operations segment profit was primarily due to the decrease in interest revenue resulting from the
progressive decline in note balances due to repayments.
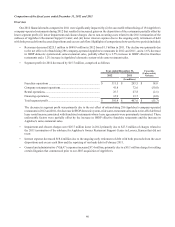
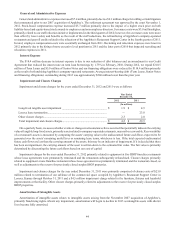
Other Expense and Income Components
Year ended December 31, Favorable
(Unfavorable)
Variance %
Change(1)
2012 2011
(In millions)
General and administrative expenses...................................... $ 163.2 $ 155.8 $ (7.4) (4.7)%
Interest expense....................................................................... 114.3 132.7 18.4 13.8 %
Impairment and closure charges.............................................. 4.2 29.9 25.7 85.9 %
Amortization of intangible assets............................................ 12.3 12.3 — —
Loss on extinguishment of debt .............................................. 5.6 11.2 5.6 50.2 %
Debt modification costs .......................................................... — 4.0 4.0 n.m.
Gain on disposition of assets................................................... (102.6)(43.3) 59.3 (137.2)%
Income tax provision............................................................... 67.2 29.8 (37.4) (125.6)%
___________________________________________________________________
(1) Percentages are calculated on actual amounts, not the rounded amounts presented above
n.m. - not meaningful