IHOP 2012 Annual Report Download - page 64
Download and view the complete annual report
Please find page 64 of the 2012 IHOP annual report below. You can navigate through the pages in the report by either clicking on the pages listed below, or by using the keyword search tool below to find specific information within the annual report.-
 1
1 -
2
-
3
-
4
-
5
-
6
-
7
-
8
-
9
-
10
-
11
-
12
-
13
-
14
-
15
-
16
-
17
-
18
-
19
-
20
-
21
-
22
-
23
-
24
-
25
-
26
-
27
-
28
-
29
-
30
-
31
-
32
-
33
-
34
-
35
-
36
-
37
-
38
-
39
-
40
-
41
-
42
-
43
-
44
-
45
-
46
-
47
-
48
-
49
-
50
-
51
-
52
-
53
-
 54
54 -
 55
55 -
 56
56 -
 57
57 -
 58
58 -
 59
59 -
 60
60 -
 61
61 -
 62
62 -
 63
63 -
 64
64 -
 65
65 -
 66
66 -
 67
67 -
 68
68 -
 69
69 -
 70
70 -
 71
71 -
 72
72 -
 73
73 -
 74
74 -
75
-
76
-
77
-
78
-
79
-
80
-
81
-
82
-
83
-
84
-
85
-
86
-
87
-
88
-
89
-
90
-
91
-
92
-
93
-
94
-
95
-
96
-
97
-
98
-
99
-
100
-
101
-
102
-
103
-
104
-
105
-
106
-
107
-
108
-
109
-
110
-
111
-
112
-
113
-
114
-
115
-
116
-
117
-
118
-
119
-
120
-
121
-
122
-
123
-
124
-
125
-
126
-
127
-
128
-
129
-
130
-
131
-
132
-
133
-
134
-
135
-
136
-
137
-
138
-
139
-
140
 |
 |

46
• Revenues decreased $258.4 million to $1.1 billion in 2011 from $1.3 billion in 2010. The decline was primarily due to
the net effect of refranchising 132 company-operated Applebee's restaurants in 2011 and 83 in the fourth quarter of 2010,
and a decrease in IHOP domestic system-wide same-restaurant sales of 2.0% , partially offset by a 3.6% increase in IHOP
effective franchise units and a 2.0% increase in Applebee's domestic system-wide same-restaurant sales.
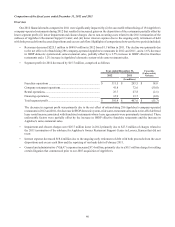
• Segment profit for 2011 decreased by $22.2 million, comprised as follows:
Year ended December 31, Favorable
(Unfavorable)
Variance
2011 2010
(In millions)
Franchise operations ....................................................................... $ 293.5 $ 273.6 $ 19.9
Company restaurant operations....................................................... 72.6 116.3 (43.7)
Rental operations............................................................................. 27.8 25.5 2.3
Financing operations....................................................................... 13.7 14.4 (0.7)
Total segment profit........................................................................ $ 407.6 $ 429.8 $ (22.2)
The decrease in segment profit was primarily due to the net effect of refranchising 215 Applebee's company-operated
restaurants since October 2010, a decline in margins at Applebee's company-operated restaurants and a 2.0% decrease
in IHOP domestic system-wide same-restaurant sales. These unfavorable factors were partially offset by $7.7 million of
charges associated with an IHOP franchisee that defaulted in 2010, the increase in IHOP effective franchise units and the
increase in Applebee's same-restaurant sales.
• Loss on extinguishment of debt was $11.2 million in 2011, compared with a loss on the extinguishment of debt of $107.0
million in 2010. The significant loss in 2010 included charges of $110.2 million related to our debt refinancing in October
2010 and the redemption of Series A Preferred Stock.
• Interest expense decreased $38.8 million due to lower non-cash interest charges as the result of the October 2010
refinancing, the ongoing early retirement of debt with excess cash flow and the repricing of our bank debt in February
2011.
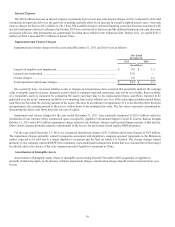
• Impairment and closure charges were $25.6 million higher in 2011 primarily due to $27.5 million of charges related to
termination of the sublease for Applebee's former Restaurant Support Center in Lenexa, Kansas.
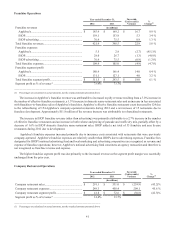
Franchise Operations
Year ended December 31, Favorable
(Unfavorable)
Variance %
Change(1)
2011 2010
(In millions)
Franchise revenues
Applebee's....................................................................... $ 169.2 $ 153.5 $ 15.7 10.3 %
IHOP............................................................................... 153.8 149.2 4.6 3.1 %
IHOP advertising ............................................................ 75.5 74.4 1.1 1.4 %
Total franchise revenues...................................................... 398.5 377.1 21.4 5.7 %
Franchise expenses
Applebee's....................................................................... 2.8 1.9 (0.9) (53.5)%
IHOP............................................................................... 26.7 27.2 0.5 1.9 %
IHOP advertising ............................................................ 75.5 74.4 (1.1) (1.4)%
Total franchise expenses...................................................... 105.0 103.5 (1.5) (1.4)%
Franchise segment profit
Applebee's....................................................................... 166.4 151.6 14.8 9.7 %
IHOP............................................................................... 127.1 122.0 5.1 4.2 %
Total franchise segment profit............................................. $ 293.5 $ 273.6 $ 19.9 7.3 %
Segment profit as % of revenue(1)........................................ 73.7% 72.6%
____________________________________________________________
(1) Percentages are calculated on actual amounts, not the rounded amounts presented above