IHOP 2012 Annual Report Download - page 60
Download and view the complete annual report
Please find page 60 of the 2012 IHOP annual report below. You can navigate through the pages in the report by either clicking on the pages listed below, or by using the keyword search tool below to find specific information within the annual report.-
 1
1 -
2
-
3
-
4
-
5
-
6
-
7
-
8
-
9
-
10
-
11
-
12
-
13
-
14
-
15
-
16
-
17
-
18
-
19
-
20
-
21
-
22
-
23
-
24
-
25
-
26
-
27
-
28
-
29
-
30
-
31
-
32
-
33
-
34
-
35
-
36
-
37
-
38
-
39
-
40
-
41
-
42
-
43
-
44
-
45
-
46
-
47
-
48
-
49
-
 50
50 -
 51
51 -
 52
52 -
 53
53 -
 54
54 -
 55
55 -
 56
56 -
 57
57 -
 58
58 -
 59
59 -
 60
60 -
 61
61 -
 62
62 -
 63
63 -
 64
64 -
 65
65 -
 66
66 -
 67
67 -
 68
68 -
 69
69 -
 70
70 -
71
-
72
-
73
-
74
-
75
-
76
-
77
-
78
-
79
-
80
-
81
-
82
-
83
-
84
-
85
-
86
-
87
-
88
-
89
-
90
-
91
-
92
-
93
-
94
-
95
-
96
-
97
-
98
-
99
-
100
-
101
-
102
-
103
-
104
-
105
-
106
-
107
-
108
-
109
-
110
-
111
-
112
-
113
-
114
-
115
-
116
-
117
-
118
-
119
-
120
-
121
-
122
-
123
-
124
-
125
-
126
-
127
-
128
-
129
-
130
-
131
-
132
-
133
-
134
-
135
-
136
-
137
-
138
-
139
-
140
 |
 |

42
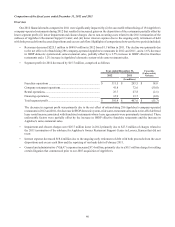
As of December 31, 2012, Company restaurant operations were comprised of 23 Applebee's company-operated restaurants
and 12 IHOP company-operated restaurants. The impact of the IHOP restaurants on all comparisons of fiscal 2012 with the same
period of 2011 was negligible.
Because of the refranchising of 154 company-operated restaurants during 2012 and 132 restaurants during 2011, company
restaurant sales decreased $239.9 million. On an effective (weighted days operated) basis, Applebee's operated 123 restaurants
during 2012 as compared with 240 restaurants during 2011. Applebee's company restaurant sales declined $244.0 million, primarily
due to the refranchising as well as a 1.0% decrease in same-restaurant sales at the remaining 23 company-operated restaurants.
Over the course of 2012, company same-restaurant sales increased 0.6% at all restaurants, including those operated prior to the
completion of refranchising. This increase in same-restaurant sales was driven mainly by an increase in average guest check
partially offset by a decline in guest traffic.
Because of the refranchising of company-operated restaurants, company restaurant expenses declined $209.1 million.
Applebee's company restaurant expenses declined $213.7 million million . The overall operating margin for Applebee's company
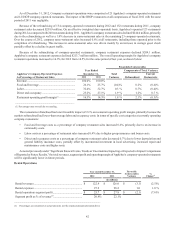
restaurant operations increased to 16.3% for 2012 from 14.5% for the same period of last year, as shown below:
Favorable (Unfavorable)
Year Ended Components of Total Variance
Applebee's Company-Operated Expenses December 31, Total Current
As Percentage of Restaurant Sales 2012 2011 Variance Refranchised Restaurants
Revenue................................................................... 100.0% 100.0%
Food and beverage................................................... 26.1% 25.7% (0.4)% 0.2% (0.6)%
Labor........................................................................ 32.4% 32.7% 0.3 % 0.7% (0.4)%
Direct and occupancy .............................................. 25.2% 27.1% 1.9 % 1.2% 0.7 %
Restaurant operating profit margin(1) ............................. 16.3% 14.5% 1.8 % 2.1% (0.3)%
_________________________________________
(1) Percentages may not add due to rounding.
The restaurants refranchised had a net favorable impact of 2.1% on restaurant operating profit margin, primarily because the
markets refranchised had lower-than-average labor and occupancy costs. In terms of specific cost categories at currently operating
company restaurants:
• Food and beverage costs as a percentage of company restaurant sales increased 0.6%, primarily due to an increase in
commodity costs.
• Labor costs as a percentage of restaurant sales increased 0.4% due to higher group insurance and bonus costs.
• Direct and occupancy costs as a percentage of company restaurant sales decreased 0.7% due to lower depreciation and
general liability insurance costs, partially offset by incremental investment in local advertising, increased repair and
maintenance costs and higher rents.
As noted previously under "Significant Known Events, Trends or Uncertainties Impacting or Expected to Impact Comparisons
of Reported or Future Results," the total revenues, segment profit and operating margin of Applebee's company-operated restaurants
will be significantly lower in future periods.
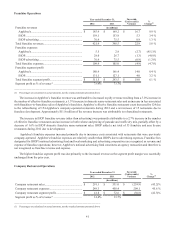
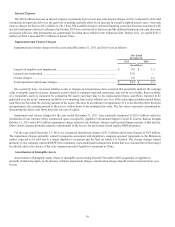
Rental Operations
Year ended December 31, Favorable
(Unfavorable)
Variance %
Change(1)
2012 2011
(In millions)
Rental revenues ................................................................... $ 122.9 $ 126.0 $ (3.1) (2.5)%
Rental expenses ................................................................... 97.2 98.2 1.0 1.0 %
Rental operations segment profit......................................... $ 25.7 $ 27.8 $ (2.1) (7.6)%
Segment profit as % of revenue(1)........................................ 20.9% 22.1%
____________________________________________________________
(1) Percentages are calculated on actual amounts, not the rounded amounts presented above