IHOP 2012 Annual Report Download - page 52
Download and view the complete annual report
Please find page 52 of the 2012 IHOP annual report below. You can navigate through the pages in the report by either clicking on the pages listed below, or by using the keyword search tool below to find specific information within the annual report.-
 1
1 -
2
-
3
-
4
-
5
-
6
-
7
-
8
-
9
-
10
-
11
-
12
-
13
-
14
-
15
-
16
-
17
-
18
-
19
-
20
-
21
-
22
-
23
-
24
-
25
-
26
-
27
-
28
-
29
-
30
-
31
-
32
-
33
-
34
-
35
-
36
-
37
-
38
-
39
-
40
-
41
-
 42
42 -
 43
43 -
 44
44 -
 45
45 -
 46
46 -
 47
47 -
 48
48 -
 49
49 -
 50
50 -
 51
51 -
 52
52 -
 53
53 -
 54
54 -
 55
55 -
 56
56 -
 57
57 -
 58
58 -
 59
59 -
 60
60 -
 61
61 -
 62
62 -
63
-
64
-
65
-
66
-
67
-
68
-
69
-
70
-
71
-
72
-
73
-
74
-
75
-
76
-
77
-
78
-
79
-
80
-
81
-
82
-
83
-
84
-
85
-
86
-
87
-
88
-
89
-
90
-
91
-
92
-
93
-
94
-
95
-
96
-
97
-
98
-
99
-
100
-
101
-
102
-
103
-
104
-
105
-
106
-
107
-
108
-
109
-
110
-
111
-
112
-
113
-
114
-
115
-
116
-
117
-
118
-
119
-
120
-
121
-
122
-
123
-
124
-
125
-
126
-
127
-
128
-
129
-
130
-
131
-
132
-
133
-
134
-
135
-
136
-
137
-
138
-
139
-
140
 |
 |

34
standards. Specific training is offered to franchisees to assist them in remediating any areas of opportunity identified in the Operations
Evaluation. In addition, IHOP modified its service procedures in 2012 to improve speed of service and improve guest satisfaction.
While results from both programs have been positive, we recognize that operations excellence is a continuous process without end.
Optimize Franchise Development and Franchise System Health
Under the Current Business Model, IHOP seeks to optimize franchise development by recruiting franchise developers within
and outside the current system and working with these franchise developers in the site selection and building process. This strategy
has proved successful as our franchisees have developed approximately 516 restaurants since the inception of the Current Business
Model and our franchisees have a pipeline of 285 additional new restaurants committed, optioned or pending. In 2012, an IHOP
franchisee opened the first IHOP restaurants in the Middle East demonstrating the interest in the IHOP brand outside of North
America. In 2013, a new international franchisee opened the first IHOP restaurant in the Philippines. We continue to explore
opportunities in new international markets. The existing franchisee base accounts for most of these future development obligations.
In addition, we may take steps to consolidate and rehabilitate existing markets if we believe that doing so is advisable in order
to fully realize development potential. We consistently monitor individual franchisee health and compliance with franchise
agreements and we may also take steps to exercise our contractual rights within the franchise agreement in the event of
noncompliance.
In a challenging economic environment and a highly competitive family dining category, there can be no assurance that the
strategies described above, when implemented, will achieve the intended results within the time frame anticipated.
Significant Known Events, Trends or Uncertainties Impacting or Expected to Impact Comparisons of Reported or
Future Results
Current Economic Conditions
The consumer continues to receive a mixture of positive and negative economic information. Gross Domestic Product ("GDP")
grew at a modest pace for the full year of 2012, but preliminary estimates for the fourth quarter of 2012 showed a slight decline.
The unemployment rate declined from December 2011 to December 2012, but the unemployment rate rose in January 2013. We
believe uncertainty over the degree and duration of the economic recovery, the impact of the expiration of the 2% payroll tax cut
that had been in place for the last two years and possible deficit reduction measures may continue to temper consumer discretionary
spending. A decline or lack of growth in disposable income for discretionary spending could cause our customers to change
purchasing behavior and choose lower-cost dining options or alternatives to dining out. These factors could have an adverse effect
on our business, results of operations and financial condition.
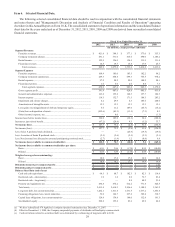
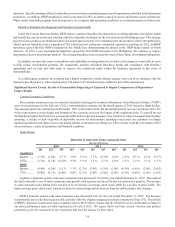
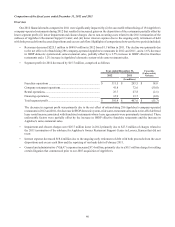
Sales Trends
Domestic System-wide Same-restaurant Sales
Increase (Decrease)
2010 2011 2012
Q1 Q2 Q3 Q4 Q1 Q2 Q3 Q4 Q1 Q2 Q3 Q4
Applebee’s
Quarter....... (2.7)% (1.6)% 3.3 % 2.9% 3.9 % 3.1 % (0.3)% 1.0 % 1.2 % 0.7 % 2.0 % 0.9 %
YTD........... (2.7)% (2.2)% (0.5)% 0.3% 3.9 % 3.5 % 2.3 % 2.0 % 1.2 % 1.0 % 1.3 % 1.2 %
IHOP
Quarter....... (0.4)% (1.0)% 0.1 % 1.1% (2.7)% (2.9)% (1.5)% (1.0)% (0.5)% (1.4)% (2.0)% (2.6)%
YTD........... (0.4)% (0.7)% (0.4)% 0.0% (2.7)% (2.8)% (2.4)% (2.0)% (0.5)% (0.9)% (1.3)% (1.6)%
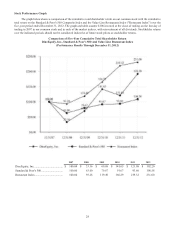
Applebee’s domestic system-wide same-restaurant sales increased 1.2% for the year ended December 31, 2012. This marked
the third consecutive year of same-restaurant sales growth, with increases in nine of the last ten consecutive quarters. The increase
in same-restaurant sales during 2012 was driven by an increase in average guest check offset by a decline in guest traffic. The
higher average guest check came from an increase in menu pricing and an increase from favorable product mix changes.
IHOP’s domestic system-wide same-restaurant sales decreased 1.6% for the year ended December 31, 2012. The decrease
was primarily due to a decline in guest traffic, partially offset by a higher average guest check compared to fiscal 2011. The decline
in IHOP's domestic system-wide same-restaurant sales in 2012 reflects, in part, that the initiatives we are undertaking to improve
our sales performance were not fully implemented for all of 2012. We expect that it will take several visitation and product
promotion cycles for consumers to see, experience and taste the actions we have taken.