IHOP 2012 Annual Report Download - page 4
Download and view the complete annual report
Please find page 4 of the 2012 IHOP annual report below. You can navigate through the pages in the report by either clicking on the pages listed below, or by using the keyword search tool below to find specific information within the annual report.-
 1
1 -
 2
2 -
 3
3 -
 4
4 -
 5
5 -
 6
6 -
 7
7 -
 8
8 -
 9
9 -
 10
10 -
 11
11 -
 12
12 -
 13
13 -
 14
14 -
 15
15 -
16
-
17
-
18
-
19
-
20
-
21
-
22
-
23
-
24
-
25
-
26
-
27
-
28
-
29
-
30
-
31
-
32
-
33
-
34
-
35
-
36
-
37
-
38
-
39
-
40
-
41
-
42
-
43
-
44
-
45
-
46
-
47
-
48
-
49
-
50
-
51
-
52
-
53
-
54
-
55
-
56
-
57
-
58
-
59
-
60
-
61
-
62
-
63
-
64
-
65
-
66
-
67
-
68
-
69
-
70
-
71
-
72
-
73
-
74
-
75
-
76
-
77
-
78
-
79
-
80
-
81
-
82
-
83
-
84
-
85
-
86
-
87
-
88
-
89
-
90
-
91
-
92
-
93
-
94
-
95
-
96
-
97
-
98
-
99
-
100
-
101
-
102
-
103
-
104
-
105
-
106
-
107
-
108
-
109
-
110
-
111
-
112
-
113
-
114
-
115
-
116
-
117
-
118
-
119
-
120
-
121
-
122
-
123
-
124
-
125
-
126
-
127
-
128
-
129
-
130
-
131
-
132
-
133
-
134
-
135
-
136
-
137
-
138
-
139
-
140
 |
 |

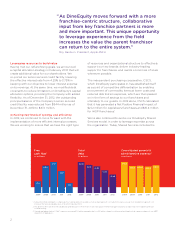
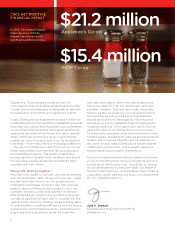
1 Net positive financial impact is comprised of net savings and cost avoidances. Net savings represent cost reductions year-over-year. Cost avoidances represent cost
increases that were avoided because of an action taken by CSCS.
2 The decline in free cash flow in fiscal 2012 was primarily due to the increase in cash taxes paid on refranchising proceeds and, as expected, lower segment profit due
to refranchising.
3 General and administrative ("G&A") expenses increased $7.4 million, primarily due to a $9.1 million charge for settling certain litigation that commenced prior to our 2007
acquisition of Applebee's.
Free
cash flow2
(in millions)
Total
debt
(in billions)
Consolidated general &
administrative expense3
(in millions)
2008 2009 2010 2011 2012 2008 2009 2010 2011 2012 2008 2009 2010 2011 2012
$135
$153
$108
$48
$57
$2.36
$2.14 $2.03
$1.73
$1.40
$182.2
$158.5 $159.6 $155.8 $163.2
“ As DineEquity moves forward with a more
franchise-centric structure, collaborative
input from key franchise partners is more
and more important. This unique opportunity
to leverage experience from the field
increases the value the parent franchisor
can return to the entire system.”
Roy Raeburn, President, Apple-Metro
Leveraging resources to build value
Having met our refranchising goals, we announced
a capital allocation strategy in February 2013 that will
create additional value for our shareholders. We
re-priced our senior secured credit facility, lowering
the effective interest rate from 4.25% to 3.75% in
keeping with our objective to lower interest expense
on borrowings. At the same time, we modified debt
covenants to reduce limitations on DineEquity’s capital
allocation options, providing the Company with added
flexibility. As of December 31, 2012, the outstanding
principal balance of the Company’s senior secured
credit facility was reduced from $844 million as of
December 31, 2010 to $472 million.
Achieving new levels of synergy and efficiency
In 2012, we continued to move forward with the
implementation of more efficient internal processes.
We are working to ensure that we have the right type
of resources and organizational structure to effectively
support our two brands; deliver industry-leading
support to franchisees, and realize economies of scale
whenever possible.
The independent purchasing cooperative, CSCS,
which DineEquity participates in, has established itself
as a point of competitive differentiation by enabling
procurement of commodity items at lower costs and
reduced distribution expenses, which are then passed
on in the form of savings to our franchisees and
ultimately to our guests. In 2012 alone, CSCS calculated
that it has generated a Net Positive Financial Impact of
$21.2 million for Applebee’s franchisees and $15.4 million
for IHOP franchisees.1
We’ve also continued to evolve our DineEquity Shared
Services model, in order to leverage expertise across
the organization. Today, Shared Services includes the
2