IHOP 2012 Annual Report Download - page 109
Download and view the complete annual report
Please find page 109 of the 2012 IHOP annual report below. You can navigate through the pages in the report by either clicking on the pages listed below, or by using the keyword search tool below to find specific information within the annual report.-
 1
1 -
2
-
3
-
4
-
5
-
6
-
7
-
8
-
9
-
10
-
11
-
12
-
13
-
14
-
15
-
16
-
17
-
18
-
19
-
20
-
21
-
22
-
23
-
24
-
25
-
26
-
27
-
28
-
29
-
30
-
31
-
32
-
33
-
34
-
35
-
36
-
37
-
38
-
39
-
40
-
41
-
42
-
43
-
44
-
45
-
46
-
47
-
48
-
49
-
50
-
51
-
52
-
53
-
54
-
55
-
56
-
57
-
58
-
59
-
60
-
61
-
62
-
63
-
64
-
65
-
66
-
67
-
68
-
69
-
70
-
71
-
72
-
73
-
74
-
75
-
76
-
77
-
78
-
79
-
80
-
81
-
82
-
83
-
84
-
85
-
86
-
87
-
88
-
89
-
90
-
91
-
92
-
93
-
94
-
95
-
96
-
97
-
98
-
 99
99 -
 100
100 -
 101
101 -
 102
102 -
 103
103 -
 104
104 -
 105
105 -
 106
106 -
 107
107 -
 108
108 -
 109
109 -
 110
110 -
 111
111 -
 112
112 -
 113
113 -
 114
114 -
 115
115 -
 116
116 -
 117
117 -
 118
118 -
 119
119 -
120
-
121
-
122
-
123
-
124
-
125
-
126
-
127
-
128
-
129
-
130
-
131
-
132
-
133
-
134
-
135
-
136
-
137
-
138
-
139
-
140
 |
 |

DineEquity, Inc. and Subsidiaries
Notes to the Consolidated Financial Statements (Continued)
16. Stock-Based Incentive Plans (Continued)
91
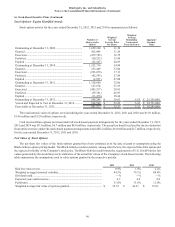
Restricted Stock and Restricted Stock Units - Equity Classified Awards
Activity in equity classified awards of restricted stock and restricted stock units for the years ended December 31, 2012, 2011
and 2010 is as follows:
Shares of
Restricted Stock
Weighted
Average
Grant-Date Per
Share
Fair Value Restricted
Stock Units
Weighted
Average
Grant-Date
Per Share
Fair Value
Outstanding at December 31, 2009 ..................................... 650,323 $ 33.09 — $ —
Granted ................................................................................ 209,505 30.52 20,000 29.32
Released............................................................................... (159,893) 48.18 (2,000) 29.32
Forfeited .............................................................................. (33,691) 34.16 — —
Outstanding at December 31, 2010 ..................................... 666,244 28.62 18,000 29.32
Granted ................................................................................ 164,632 53.03 — —
Released............................................................................... (287,735) 37.82 — —
Forfeited .............................................................................. (56,608) 31.56 — —
Outstanding at December 31, 2011 ..................................... 486,533 31.08 18,000 29.32
Granted ................................................................................ 137,852 52.23 19,152 52.23
Released............................................................................... (179,465) 13.83 (3,910) 40.58
Forfeited .............................................................................. (98,357) 44.40 — —
Outstanding at December 31, 2012 ..................................... 346,563 $ 44.74 33,242 $ 41.19
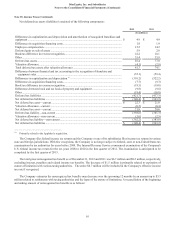
Restricted Stock Units - Liability Classified Awards
The Company has granted cash-settled restricted stock units to members of the Board of Directors.These instruments are
recorded as liabilities at fair value as of the respective period end. Activity in liability classified awards of restricted stock units
for the years ended December 31, 2012, 2011 and 2010 is as follows:
Cash-Settled
Restricted Stock
Units
Weighted
Average
Per
Share
Fair Value
Outstanding at December 31, 2009 .......................................................................................... — $ —
Granted ..................................................................................................................................... 29,000 61.07
Released.................................................................................................................................... (3,000) 33.67
Outstanding at December 31, 2010 .......................................................................................... 26,000 64.23
Granted ..................................................................................................................................... 15,957 64.30
Released.................................................................................................................................... — —
Outstanding at December 31, 2011........................................................................................... 41,957 64.26
Granted ..................................................................................................................................... — —
Released.................................................................................................................................... (4,773) 49.66
Outstanding at December 31, 2012 .......................................................................................... 37,184 $ 66.13
For the years ended December 31, 2012, 2011 and 2010, $1.0 million, $0.5 million and $1.2 million, respectively, was included
as stock-based compensation expense related to these cash-settled restricted stock units. At December 31, 2012 and 2011, liabilities
of $2.4 million and $1.6 million, respectively, were included as other accrued expenses in the consolidated balance sheet.
The Company has granted cash long-term incentive awards to certain employees ("LTIP awards"). Annual LTIP awards vest
over a three-year period and are determined using a multiplier from 0% to 200% of the target award based on the total shareholder
return of DineEquity, Inc. common stock compared to the total shareholder returns of a peer group of companies. Though LTIP
awards are only paid in cash, since the multiplier is based on the price of the Company's common stock, the awards are considered
stock-based compensation in accordance with U.S. GAAP and are classified as liabilities. For the years ended December 31,
2012, 2011 and 2010, $3.8 million, $0.6 million and $0.9 million, respectively, was included in stock-based compensation expense
related to the LTIP awards. At December 31, 2012 and 2011, liabilities of $4.5 million and $1.6 million, respectively, were included
as accrued employee compensation and benefits in the consolidated balance sheet.