IHOP 2012 Annual Report Download - page 49
Download and view the complete annual report
Please find page 49 of the 2012 IHOP annual report below. You can navigate through the pages in the report by either clicking on the pages listed below, or by using the keyword search tool below to find specific information within the annual report.-
 1
1 -
2
-
3
-
4
-
5
-
6
-
7
-
8
-
9
-
10
-
11
-
12
-
13
-
14
-
15
-
16
-
17
-
18
-
19
-
20
-
21
-
22
-
23
-
24
-
25
-
26
-
27
-
28
-
29
-
30
-
31
-
32
-
33
-
34
-
35
-
36
-
37
-
38
-
 39
39 -
 40
40 -
 41
41 -
 42
42 -
 43
43 -
 44
44 -
 45
45 -
 46
46 -
 47
47 -
 48
48 -
 49
49 -
 50
50 -
 51
51 -
 52
52 -
 53
53 -
 54
54 -
 55
55 -
 56
56 -
 57
57 -
 58
58 -
 59
59 -
60
-
61
-
62
-
63
-
64
-
65
-
66
-
67
-
68
-
69
-
70
-
71
-
72
-
73
-
74
-
75
-
76
-
77
-
78
-
79
-
80
-
81
-
82
-
83
-
84
-
85
-
86
-
87
-
88
-
89
-
90
-
91
-
92
-
93
-
94
-
95
-
96
-
97
-
98
-
99
-
100
-
101
-
102
-
103
-
104
-
105
-
106
-
107
-
108
-
109
-
110
-
111
-
112
-
113
-
114
-
115
-
116
-
117
-
118
-
119
-
120
-
121
-
122
-
123
-
124
-
125
-
126
-
127
-
128
-
129
-
130
-
131
-
132
-
133
-
134
-
135
-
136
-
137
-
138
-
139
-
140
 |
 |

31
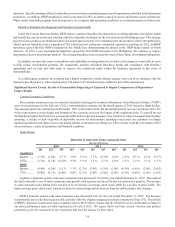
Other highlights of our fiscal 2012 performance include:
• Reducing our long-term debt by $332.6 million, which lowered our consolidated leverage ratio to 4.6:1 at December 31,
2012 from 5.3:1 at December 31, 2011. The reduction primarily came from a combination of after-tax cash proceeds and
elimination of financing obligations from the refranchising of Applebee's company-operated restaurants and from our
free cash flow;
• Increasing Applebee's domestic same-restaurant sales by 1.2% during 2012, the third consecutive year of same-restaurant
sales growth. Applebee's same-restaurant sales have increased in nine of the last ten quarters;
• Opening 48 new restaurants worldwide by IHOP franchisees and area licensees and 34 new restaurants by Applebee's
franchisees. IHOP's international footprint was expanded with franchise openings in the Middle East and the Dominican
Republic;
• Remodeling over 560 restaurants system-wide during 2012. Applebee's and its franchisees remodeled 370 restaurants
during 2012, while IHOP and its franchisees remodeled 191 restaurants. Over the past two years, 51% of Applebee's
restaurants and approximately one-third of IHOP restaurants have been remodeled;
• Executing a comprehensive restructuring of general and administrative functions that will reduce future costs. While the
severance costs associated with headcount reductions exceeded savings in fiscal 2012, we estimate these actions will
save approximately $10 million to $12 million on a annualized basis in the future; and
• Establishing new Centers of Excellence to pool talent from across our organization to realize synergies, share best practices
and eliminate duplication of effort.
Key Performance Indicators
In evaluating and assessing the performance of our business, we consider our key performance indicators to be: (i) the
percentage change in domestic system-wide same-restaurant sales; (ii) net franchise restaurant development; (iii) consolidated
cash from operations; and (iv) consolidated free cash flow. An overview of our 2012 performance in these metrics is as follows:
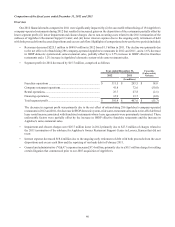
Applebee's IHOP
Percentage change in domestic system-wide same-restaurant sales ....................... 1.2% (1.6)%
Net franchise restaurant development(1).................................................................................... 15 31
(1) Franchise and area license openings, net of closings and the refranchising of 154 Applebee's company-operated restaurants and two rehabilitated
and refranchised IHOP restaurants
For the year ended December 31, 2012, our consolidated cash from operations was $52.9 million and our consolidated free
cash flow was $48.2 million.
We achieved mixed results on these metrics in 2012. Applebee's achieved an increase in domestic system-wide same-restaurant
sales for the third consecutive year. Applebee's cumulative increase over those three years is 3.5%, a significant achievement in
light of the headwinds we faced as the country and our guests recovered from the 2008 economic crisis. IHOP, on the other hand,
had a decline in its domestic system-wide same-restaurant sales for the second consecutive year, although the decline in 2012 was
less than in 2011.
IHOP franchisees and area licensees opened 48 new franchise restaurants in 2012, with net openings (openings less closings
and refranchisings) of 31 restaurants. Over the past three years, IHOP has achieved 125 net openings, an annual growth rate of
nearly 3%. Applebee's franchisees opened 34 new franchise restaurants in 2012, with net openings of 15 restaurants. Over the past
three years, Applebee's net openings totaled 33 restaurants, an annual growth rate of under 1%.
Both cash from operations and free cash flow decreased approximately 55% from the prior year. The majority of the decline
was the expected result of the refranchising of Applebee's company-operated restaurants in terms of both restaurant operating
profit foregone and payment of taxes on gains from the sale of restaurant assets. While proceeds from asset sales are an investing
cash inflow, all income taxes paid are an operating cash outflow.
Additional information on each of these metrics is presented under the captions "Restaurant Data," "Company Restaurant
Operations" and "Liquidity and Capital Resources" below.