IHOP 2012 Annual Report Download - page 22
Download and view the complete annual report
Please find page 22 of the 2012 IHOP annual report below. You can navigate through the pages in the report by either clicking on the pages listed below, or by using the keyword search tool below to find specific information within the annual report.-
 1
1 -
2
-
3
-
4
-
5
-
6
-
7
-
8
-
9
-
10
-
11
-
 12
12 -
 13
13 -
 14
14 -
 15
15 -
 16
16 -
 17
17 -
 18
18 -
 19
19 -
 20
20 -
 21
21 -
 22
22 -
 23
23 -
 24
24 -
 25
25 -
 26
26 -
 27
27 -
 28
28 -
 29
29 -
 30
30 -
 31
31 -
 32
32 -
33
-
34
-
35
-
36
-
37
-
38
-
39
-
40
-
41
-
42
-
43
-
44
-
45
-
46
-
47
-
48
-
49
-
50
-
51
-
52
-
53
-
54
-
55
-
56
-
57
-
58
-
59
-
60
-
61
-
62
-
63
-
64
-
65
-
66
-
67
-
68
-
69
-
70
-
71
-
72
-
73
-
74
-
75
-
76
-
77
-
78
-
79
-
80
-
81
-
82
-
83
-
84
-
85
-
86
-
87
-
88
-
89
-
90
-
91
-
92
-
93
-
94
-
95
-
96
-
97
-
98
-
99
-
100
-
101
-
102
-
103
-
104
-
105
-
106
-
107
-
108
-
109
-
110
-
111
-
112
-
113
-
114
-
115
-
116
-
117
-
118
-
119
-
120
-
121
-
122
-
123
-
124
-
125
-
126
-
127
-
128
-
129
-
130
-
131
-
132
-
133
-
134
-
135
-
136
-
137
-
138
-
139
-
140
 |
 |

4
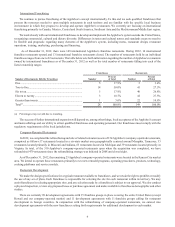
Company Operations Segment
As of December 31, 2012, the company restaurant operations segment consisted of 23 Applebee's company-operated
restaurants, 10 IHOP company-operated restaurants and two IHOP restaurants reacquired from franchisees and operated by IHOP
on a temporary basis until refranchised. All company-operated restaurants are in the United States and are primarily used to test
new remodel programs, operating procedures, products, technology, cooking platforms and service models.
Company restaurant sales are retail sales at company-operated restaurants. Company restaurant expenses are operating
expenses at company-operated restaurants and include food, beverage, labor, utilities, rent and other restaurant operating costs.
Rental Operations Segment
Rental operations revenue includes revenue from operating leases and interest income from direct financing leases. Rental
operations expenses are costs of operating leases and interest expense on capital leases on franchisee-operated restaurants. The
rental operations revenue and expenses are primarily generated by IHOP. Applebee's has an insignificant amount of rental activity
that only relates to properties that are retained after refranchising company-operated restaurants until such time as the properties
can be disposed of by sale.
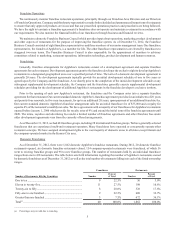
Financing Operations Segment
Financing operations revenue primarily consists of interest income from the financing of franchise fees and equipment leases,
as well as sales of equipment associated with refranchised IHOP restaurants and a portion of franchise fees for restaurants taken
back from franchisees not allocated to IHOP intellectual property. Financing expenses are primarily the cost of restaurant equipment.
Financial information for our four operating segments for the last three fiscal years is set forth in Note 20, Segment Reporting,
of the Notes to the Consolidated Financial Statements included in this report. Revenue derived from all foreign countries, in the
aggregate, comprises less than 2% of total consolidated revenue.
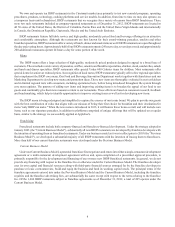
Restaurant Concepts
Applebee's
We develop, franchise and operate restaurants in the bar and grill segment of the casual dining category of the restaurant
industry under the name "Applebee's Neighborhood Grill & Bar." With 2,034 system-wide restaurants as of December 31, 2012,
Applebee's is the largest casual dining concept in the world, in terms of number of restaurants and market share(1). As of December 31,
2012, 68 franchise groups operated 2,011 of these restaurants and 23 restaurants were company-operated. The restaurants were
located in 49 states, one United States territory and 15 countries outside of the United States.
Each Applebee's restaurant is designed as an attractive, friendly, neighborhood establishment featuring high quality,
moderately-priced food, alcoholic and non-alcoholic beverage items, table service and a comfortable atmosphere. Applebee's
restaurants appeal to a wide range of customers including young adults, senior citizens and families with children.
Menu
Applebee's restaurants offer a diverse menu offering fresh, flavorful and fun-to-eat food at a great value. The menu features
a broad selection of signature dishes and traditional entrées, as well as appetizers, salads, sandwiches, specialty drinks and desserts.
All Applebee's restaurants offer beer, wine, liquor and premium specialty drinks. Applebee's updates its menu offerings regularly
to better serve our customers and give them new reasons to return to our restaurants. Since 2007, more than 90% of Applebee's
menu now consists of either new offerings or improved offerings with high quality ingredients.
Our signature “2 for $20” menu, first introduced in 2009, and the “2 for $24” trade-up option continue to resonate with our
guests, and have been imitated by many of our competitors. Our "Sizzling Entrees" menu, introduced in 2010, has also generated
strong guest appeal. The innovative “Unbelievably Great Tasting & Under 550 CaloriesTM” menu provides our guests with great
tasting, generous portions that support their health and nutritional goals. Each of these platforms is refreshed regularly throughout
the year with new menu choices to give guests reasons to come to Applebee's every day.
In 2009, Applebee's entered into a non-exclusive endorsement agreement with Weight Watchers International, Inc. ("Weight
Watchers") to offer Weight Watchers® branded menu items to our guests. Under the agreement, Applebee's and participating
franchisees pay Weight Watchers a royalty equal to 2.5% of the proceeds from the sale of Weight Watchers-endorsed items on the
Applebee's menu. The agreement has been extended through at least November 2014.
__________________________________________________________________________
(1) Source: Nation's Restaurant News, "Special Report: Top 100," June 25, 2012 (market share based on U.S. system-wide sales in the casual dining category).