IHOP 2012 Annual Report Download - page 87
Download and view the complete annual report
Please find page 87 of the 2012 IHOP annual report below. You can navigate through the pages in the report by either clicking on the pages listed below, or by using the keyword search tool below to find specific information within the annual report.-
 1
1 -
2
-
3
-
4
-
5
-
6
-
7
-
8
-
9
-
10
-
11
-
12
-
13
-
14
-
15
-
16
-
17
-
18
-
19
-
20
-
21
-
22
-
23
-
24
-
25
-
26
-
27
-
28
-
29
-
30
-
31
-
32
-
33
-
34
-
35
-
36
-
37
-
38
-
39
-
40
-
41
-
42
-
43
-
44
-
45
-
46
-
47
-
48
-
49
-
50
-
51
-
52
-
53
-
54
-
55
-
56
-
57
-
58
-
59
-
60
-
61
-
62
-
63
-
64
-
65
-
66
-
67
-
68
-
69
-
70
-
71
-
72
-
73
-
74
-
75
-
76
-
 77
77 -
 78
78 -
 79
79 -
 80
80 -
 81
81 -
 82
82 -
 83
83 -
 84
84 -
 85
85 -
 86
86 -
 87
87 -
 88
88 -
 89
89 -
 90
90 -
 91
91 -
 92
92 -
 93
93 -
 94
94 -
 95
95 -
 96
96 -
 97
97 -
98
-
99
-
100
-
101
-
102
-
103
-
104
-
105
-
106
-
107
-
108
-
109
-
110
-
111
-
112
-
113
-
114
-
115
-
116
-
117
-
118
-
119
-
120
-
121
-
122
-
123
-
124
-
125
-
126
-
127
-
128
-
129
-
130
-
131
-
132
-
133
-
134
-
135
-
136
-
137
-
138
-
139
-
140
 |
 |

DineEquity, Inc. and Subsidiaries
Notes to the Consolidated Financial Statements (Continued)
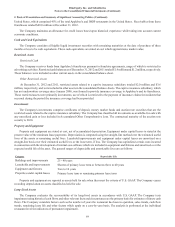
2. Basis of Presentation and Summary of Significant Accounting Policies (Continued)
69
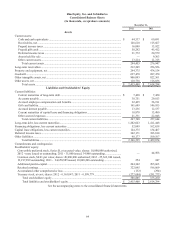
United States, which comprised 45% of the total Applebee's and IHOP restaurants in the United States. Receivables from these
franchisees totaled $48.8 million at December 31, 2012.
The Company maintains an allowance for credit losses based upon historical experience while taking into account current
economic conditions.
Cash and Cash Equivalents
The Company considers all highly liquid investment securities with remaining maturities at the date of purchase of three
months or less to be cash equivalents. These cash equivalents are stated at cost which approximates market value.
Restricted Assets
Restricted Cash
The Company receives funds from Applebee's franchisees pursuant to franchise agreements, usage of which is restricted to
advertising activities. Restricted cash balances as of December 31, 2012 and 2011 totaled $1.9 million and $1.2 million, respectively.
These balances were included as other current assets in the consolidated balance sheet.
Other Restricted Assets
At December 31, 2012 and 2011, restricted assets related to a captive insurance subsidiary totaled $2.0 million and $3.6
million, respectively, and were included in other assets in the consolidated balance sheets. The captive insurance subsidiary, which
has not underwritten coverage since January 2006, was formed to provide insurance coverage to Applebee's and its franchisees.
These restricted assets were primarily investments, use of which is restricted to the payment of insurance claims for incidents that
occurred during the period the insurance coverage had been provided.
Investments
The Company's investments comprise certificates of deposit, money market funds and auction rate securities that are the
restricted assets related to the captive insurance subsidiary. The Company has classified all investments as available-for-sale with
any unrealized gain or loss included in Accumulated Other Comprehensive Loss. The contractual maturity of the auction rate
security is 2030.
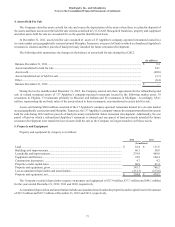
Property and Equipment
Property and equipment are stated at cost, net of accumulated depreciation. Equipment under capital leases is stated at the
present value of the minimum lease payments. Depreciation is computed using the straight-line method over the estimated useful
lives of the assets or remaining useful lives. Leasehold improvements and equipment under capital leases are amortized on a
straight-line basis over their estimated useful lives or the lease term, if less. The Company has capitalized certain costs incurred
in connection with the development of internal-use software which are included in equipment and fixtures and amortized over the
expected useful life of the asset. The general ranges of depreciable and amortizable lives are as follows:
Category Depreciable Life
Buildings and improvements 25 - 40 years
Leaseholds and improvements Shorter of primary lease term or between three to 40 years
Equipment and fixtures Two to 10 years
Properties under capital leases Primary lease term or remaining primary lease term
Property and equipment are reported as assets held for sale when they meet the criteria of U.S. GAAP. The Company ceases
recording depreciation on assets classified as held for sale.
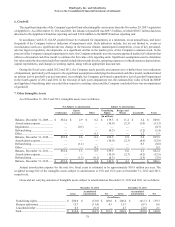
Long-Lived Assets
The Company evaluates the recoverability of its long-lived assets in accordance with U.S. GAAP. The Company tests
impairment using historical cash flows and other relevant facts and circumstances as the primary basis for estimates of future cash
flows. The Company considers factors such as the number of years the restaurant has been in operation, sales trends, cash flow
trends, remaining lease life and other factors which apply on a case-by-case basis. The analysis is performed at the individual
restaurant level for indicators of permanent impairment.