IHOP 2012 Annual Report Download - page 74
Download and view the complete annual report
Please find page 74 of the 2012 IHOP annual report below. You can navigate through the pages in the report by either clicking on the pages listed below, or by using the keyword search tool below to find specific information within the annual report.-
 1
1 -
2
-
3
-
4
-
5
-
6
-
7
-
8
-
9
-
10
-
11
-
12
-
13
-
14
-
15
-
16
-
17
-
18
-
19
-
20
-
21
-
22
-
23
-
24
-
25
-
26
-
27
-
28
-
29
-
30
-
31
-
32
-
33
-
34
-
35
-
36
-
37
-
38
-
39
-
40
-
41
-
42
-
43
-
44
-
45
-
46
-
47
-
48
-
49
-
50
-
51
-
52
-
53
-
54
-
55
-
56
-
57
-
58
-
59
-
60
-
61
-
62
-
63
-
 64
64 -
 65
65 -
 66
66 -
 67
67 -
 68
68 -
 69
69 -
 70
70 -
 71
71 -
 72
72 -
 73
73 -
 74
74 -
 75
75 -
 76
76 -
 77
77 -
 78
78 -
 79
79 -
 80
80 -
 81
81 -
 82
82 -
 83
83 -
 84
84 -
85
-
86
-
87
-
88
-
89
-
90
-
91
-
92
-
93
-
94
-
95
-
96
-
97
-
98
-
99
-
100
-
101
-
102
-
103
-
104
-
105
-
106
-
107
-
108
-
109
-
110
-
111
-
112
-
113
-
114
-
115
-
116
-
117
-
118
-
119
-
120
-
121
-
122
-
123
-
124
-
125
-
126
-
127
-
128
-
129
-
130
-
131
-
132
-
133
-
134
-
135
-
136
-
137
-
138
-
139
-
140
 |
 |
56
Financing Activities
Financing activities used net cash of $214.5 million during 2012. Cash used in financing activities primarily consisted of
$226.9 million in repayments of long-term debt, partially offset by a net financing cash inflow of $13.2 million from equity-based
compensation transactions. Of the long-term debt repayments, $210.5 million related to Term Loans, $5.5 million related to Senior
Notes (including $0.5 million of premiums) and $10.8 million was scheduled repayments of capital leases and financing obligations.
During 2012, we borrowed and repaid $50.0 million under our Revolving Facility.
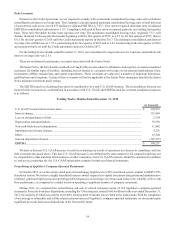
Free Cash Flow
We define "free cash flow" for a given period as cash provided by operating activities, plus receipts from notes, equipment
contracts and other long-term receivables ("long-term receivables"), less dividends paid and capital expenditures. We believe this
information is helpful to investors to determine our cash available for general corporate and strategic purposes, including the
implementation of our capital allocation strategy.
Free cash flow is considered to be a non-U.S. GAAP measure. Reconciliation of the cash provided by operating activities to
free cash flow is as follows:
Year Ended December 31,
2012 2011 2010
(In millions)
Cash flows provided by operating activities............................... $ 52.9 $ 121.7 $ 179.3
Principal receipts from notes, equipment contracts and other
long-term receivables.............................................................. 12.3 13.1 19.4
Dividends paid............................................................................ ——(26.1)
Additions to property and equipment ......................................... (17.0)(26.3)(18.7)
Free cash flow............................................................................ $ 48.2 $ 108.5 $ 153.9
This non-U.S. GAAP measure is not defined in the same manner by all companies and may not be comparable to other
similarly titled measures of other companies. Non-U.S. GAAP measures should be considered in addition to, and not as a substitute
for, the U.S. GAAP information contained within our financial statements.
Free cash flow totaled $48.2 million during the year ended December 31, 2012 compared to $108.5 million in the same period
in 2011, a decline of $60.3 million. This decline was due to the decrease in cash provided by operating activities discussed above,
partially offset by a decrease in capital expenditures.
Dividends
We did not pay dividends on our common stock in 2012. As discussed in "Restricted Payments" above, payment of dividends
is subject to limitations under our Credit Agreement. We evaluate dividend payments on common stock within the context of our
overall capital allocation strategy with our Board of Directors on an ongoing basis, giving consideration to our current and forecast
earnings, financial condition, cash requirements, limitations under the Credit Agreement and other factors. On February 26, 2013,
our Board of Directors approved payment of a cash dividend of $0.75 per share of the our common stock, payable at the close of
business on March 29, 2013 to the stockholders of record as of the close of business on March 15, 2013.
Share Repurchases
As discussed in "Restricted Payments" above, repurchases of common stock are subject to limitations under our Credit
Agreement. We evaluate repurchases of common stock within the context of our overall capital allocation strategy with our Board
of Directors on an ongoing basis, giving consideration to our current and forecast earnings, financial condition, cash requirements,
limitations under the Credit Agreement and other factors.
In August 2011, our Board of Directors authorized the repurchase up to $45 million of DineEquity common stock. Repurchases
are subject to prevailing market prices and may take place in open market transactions and in privately negotiated transactions,
based on business, market, applicable legal requirements and other considerations. The program does not require the repurchase
of a specific number of shares and may be terminated at any time. There were no repurchases of our common stock during 2012.
As of December 31, 2012, we have repurchased 534,101 shares under this program at an average price of $39.64 per share.