IHOP 2012 Annual Report Download - page 29
Download and view the complete annual report
Please find page 29 of the 2012 IHOP annual report below. You can navigate through the pages in the report by either clicking on the pages listed below, or by using the keyword search tool below to find specific information within the annual report.-
 1
1 -
2
-
3
-
4
-
5
-
6
-
7
-
8
-
9
-
10
-
11
-
12
-
13
-
14
-
15
-
16
-
17
-
18
-
 19
19 -
 20
20 -
 21
21 -
 22
22 -
 23
23 -
 24
24 -
 25
25 -
 26
26 -
 27
27 -
 28
28 -
 29
29 -
 30
30 -
 31
31 -
 32
32 -
 33
33 -
 34
34 -
 35
35 -
 36
36 -
 37
37 -
 38
38 -
 39
39 -
40
-
41
-
42
-
43
-
44
-
45
-
46
-
47
-
48
-
49
-
50
-
51
-
52
-
53
-
54
-
55
-
56
-
57
-
58
-
59
-
60
-
61
-
62
-
63
-
64
-
65
-
66
-
67
-
68
-
69
-
70
-
71
-
72
-
73
-
74
-
75
-
76
-
77
-
78
-
79
-
80
-
81
-
82
-
83
-
84
-
85
-
86
-
87
-
88
-
89
-
90
-
91
-
92
-
93
-
94
-
95
-
96
-
97
-
98
-
99
-
100
-
101
-
102
-
103
-
104
-
105
-
106
-
107
-
108
-
109
-
110
-
111
-
112
-
113
-
114
-
115
-
116
-
117
-
118
-
119
-
120
-
121
-
122
-
123
-
124
-
125
-
126
-
127
-
128
-
129
-
130
-
131
-
132
-
133
-
134
-
135
-
136
-
137
-
138
-
139
-
140
 |
 |

11
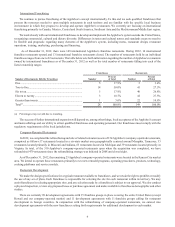
Composition of Franchise System
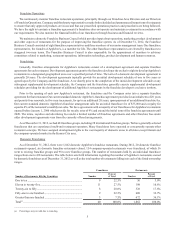
As of December 31, 2012, there were 1,525 domestic IHOP franchise and area license restaurants. During 2012, our franchisees
and area licensees opened 40 domestic franchise restaurants and 17 domestic franchise and area license restaurants were closed.
The number of restaurants held by an individual franchisee ranges from one to 152 restaurants. The table below sets forth information
regarding the number of IHOP restaurants owned by domestic franchisees as of December 31, 2012 as well as the total number
of restaurants falling into each of the listed ownership ranges.
Franchisees Restaurants
Number of Restaurants Held by Franchisee Number Percent of
Total Number Percent of
Total
One ...................................................................................... 158 46.7% 158 10.4%
Two to five........................................................................... 119 35.2% 332 21.8%
Six to ten.............................................................................. 30 8.9% 237 15.5%
Eleven to fifteen .................................................................. 14 4.1% 183 12.0%
Sixteen and over .................................................................. 17 5.0% 615 40.3%
Total(a)............................................................................................ 338 100.0% 1,525 100.0%
________________________________
(a) Percentages may not add due to rounding.
As of December 31, 2012, there were 44 international IHOP franchise and area license restaurants. During 2012, our franchisees
opened eight international franchise restaurants and no restaurants were closed. The number of restaurants held by an individual
franchisee ranges from one to 13 restaurants. The table below sets forth information regarding the number of IHOP restaurants
owned by international franchisees as of December 31, 2012 as well as the total number of restaurants falling into each of the
listed ownership ranges.
Franchisees Restaurants
Number of Restaurants Held by Franchisee Number Percent of
Total Number Percent of
Total
One ...................................................................................... 3 23.1% 3 6.8%
Two to ten............................................................................ 9 69.2% 28 63.6%
Greater than ten ................................................................... 1 7.7% 13 29.5%
Total(a)............................................................................................ 13 100.0% 44 100.0%
________________________________
(a) Percentages may not add due to rounding.
Marketing and Advertising
IHOP franchisees and company-operated restaurants contribute a percentage of their sales to local advertising cooperatives
and a national advertising fund. The franchise agreements provide for local and national advertising fees. The local advertising
cooperatives have historically used advertising fees for various local marketing programs. The national marketing fund is primarily
used for buying media and national advertising and also for the production of advertising. The national marketing fund is also
used to defray certain expenses associated with our marketing and advertising functions.
Since 2005, we and our franchisees have allocated a portion of the local advertising fees to national media in order to take
advantage of purchasing efficiencies associated with national broadcast, syndication and cable media. For the past four years, the
franchisees agreed to reallocate a greater portion of their local advertising fees to national media, which resulted in more television
advertising on national broadcast, syndication and cable media. We also have expanded the scope of our gift card program and
increased our third-party retailer base to market our gift cards.
Our goal is to attract new guests to our restaurants and to encourage our existing guests to come more often through focused
and compelling communications. To make sure we are breaking through today's competitive media landscape and maximizing
our advertising spending through an improved buying process, we are focusing our media planning on strengthening media weights
in key decision time periods, developing a stronger on-air presence and diversifying our media mix to reach our guests more
effectively.