IHOP 2012 Annual Report Download - page 73
Download and view the complete annual report
Please find page 73 of the 2012 IHOP annual report below. You can navigate through the pages in the report by either clicking on the pages listed below, or by using the keyword search tool below to find specific information within the annual report.-
 1
1 -
2
-
3
-
4
-
5
-
6
-
7
-
8
-
9
-
10
-
11
-
12
-
13
-
14
-
15
-
16
-
17
-
18
-
19
-
20
-
21
-
22
-
23
-
24
-
25
-
26
-
27
-
28
-
29
-
30
-
31
-
32
-
33
-
34
-
35
-
36
-
37
-
38
-
39
-
40
-
41
-
42
-
43
-
44
-
45
-
46
-
47
-
48
-
49
-
50
-
51
-
52
-
53
-
54
-
55
-
56
-
57
-
58
-
59
-
60
-
61
-
62
-
 63
63 -
 64
64 -
 65
65 -
 66
66 -
 67
67 -
 68
68 -
 69
69 -
 70
70 -
 71
71 -
 72
72 -
 73
73 -
 74
74 -
 75
75 -
 76
76 -
 77
77 -
 78
78 -
 79
79 -
 80
80 -
 81
81 -
 82
82 -
 83
83 -
84
-
85
-
86
-
87
-
88
-
89
-
90
-
91
-
92
-
93
-
94
-
95
-
96
-
97
-
98
-
99
-
100
-
101
-
102
-
103
-
104
-
105
-
106
-
107
-
108
-
109
-
110
-
111
-
112
-
113
-
114
-
115
-
116
-
117
-
118
-
119
-
120
-
121
-
122
-
123
-
124
-
125
-
126
-
127
-
128
-
129
-
130
-
131
-
132
-
133
-
134
-
135
-
136
-
137
-
138
-
139
-
140
 |
 |

55
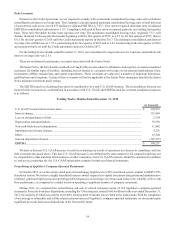
Cash Flows
In summary, our cash flows were as follows:
2012 2011 2010
(In millions)
Net cash provided by operating activities....................................................... $ 52.9 $ 121.7 $ 179.3
Net cash provided by investing activities ....................................................... 165.4 101.7 53.5
Net cash used in financing activities............................................................... (214.5)(265.0)(212.8)
Net increase (decrease) in cash and cash equivalents..................................... $ 3.8 $ (41.6) $ 20.0
Operating Activities
Cash provided by operating activities is primarily driven by revenues earned and collected from our franchisees, operating
earnings from our company-operated restaurants and profit from our rental operations and financing operations. Franchise revenues
consist of royalties, IHOP advertising fees and sales of proprietary products for IHOP, each of which fluctuates with increases or
decreases in franchise retail sales. Franchise retail sales are impacted by the development of IHOP and Applebee's restaurants by
our franchisees and by fluctuations in same-restaurant sales. Operating earnings from company-operated restaurants are impacted
by many factors which include but are not limited to changes in traffic patterns, pricing activities and changes in operating expenses.
Rental operations profit is rental income less rental expenses. Rental income includes revenues from operating leases and interest
income from direct financing leases. Rental income is impacted by fluctuations in same-restaurant sales as some operating leases
include a provision for contingent rent based on retail sales and a progressive decline in rental income as leases expire. Rental
expenses are costs of prime operating leases and interest expense on prime capital leases on franchisee-operated restaurants.
Financing operations revenue consists of interest income from the financing of franchise fees and equipment leases as well as
periodic sales of equipment. Financing income is impacted by a progressive decline in interest revenue as the obligations financed
are repaid. Financing expenses are primarily the cost of restaurant equipment.
Cash provided by operating activities totaled $52.9 million during the year ended December 31, 2012 compared to $121.7
million in the same period in 2011, a decrease of $68.8 million. The primary reasons for this unfavorable change were an increase
of $67.2 million in income taxes paid in cash, and a $26.3 million decrease in segment profit, excluding depreciation and other
non-cash changes, partially offset by a decrease of $25.1 million in cash interest payments. The increase in income taxes paid was
primarily due to gains on the refranchising and sale of related restaurant assets of Applebee's company-operated restaurants, as
well as a tax refund of $20 million received in 2011 that did not recur in 2012. Proceeds from asset sales are an investing cash
inflow while all income taxes paid are an operating cash outflow. The lower segment profit was due, in large part, to the refranchising
of 286 Applebee's company-operated restaurants over the past two years. Cash interest expense was lower due to the retirement
of debt.
Investing Activities
Net cash provided by investing activities in 2012 was primarily attributable to $168.9 million of proceeds from dispositions
of assets, primarily the refranchising of 154 Applebee's company-operated restaurants, and $12.3 million of principal receipts
from notes, equipment contracts and other long-term receivables, partially offset by $17.0 million of capital expenditures. Capital
expenditures decreased from $26.3 million in 2011 due primarily to a decline in the number of company-operated restaurants. We
expect capital expenditures to range between approximately $8 million and $10 million in fiscal 2013, also because of the decline
in the number of company-operated restaurants.
The following table represents the principal receipts on various long-term receivables due from our franchisees as of
December 31, 2012:
Principal Receipts Due By Period
2013 2014 2015 2016 2017 Thereafter Total
(In millions)
Equipment leases(1) ........................ $ 6.8 $ 7.1 $ 7.7 $ 8.0 $ 8.5 $ 84.3 $ 122.4
Direct financing leases(2)................. 6.2 7.3 8.1 8.9 10.2 54.4 95.1
Franchise notes and other(3) .............. 1.2 0.8 0.7 0.3 0.1 0.1 3.2
Total.................................................. $ 14.2 $ 15.2 $ 16.5 $ 17.2 $ 18.8 $ 138.8 $ 220.7
_______________________________
(1) Equipment lease receivables extend through the year 2029.
(2) Direct financing lease receivables extend through the year 2024.
(3) Franchise note receivables extend through the year 2020.