IHOP 2012 Annual Report Download - page 120
Download and view the complete annual report
Please find page 120 of the 2012 IHOP annual report below. You can navigate through the pages in the report by either clicking on the pages listed below, or by using the keyword search tool below to find specific information within the annual report.-
 1
1 -
2
-
3
-
4
-
5
-
6
-
7
-
8
-
9
-
10
-
11
-
12
-
13
-
14
-
15
-
16
-
17
-
18
-
19
-
20
-
21
-
22
-
23
-
24
-
25
-
26
-
27
-
28
-
29
-
30
-
31
-
32
-
33
-
34
-
35
-
36
-
37
-
38
-
39
-
40
-
41
-
42
-
43
-
44
-
45
-
46
-
47
-
48
-
49
-
50
-
51
-
52
-
53
-
54
-
55
-
56
-
57
-
58
-
59
-
60
-
61
-
62
-
63
-
64
-
65
-
66
-
67
-
68
-
69
-
70
-
71
-
72
-
73
-
74
-
75
-
76
-
77
-
78
-
79
-
80
-
81
-
82
-
83
-
84
-
85
-
86
-
87
-
88
-
89
-
90
-
91
-
92
-
93
-
94
-
95
-
96
-
97
-
98
-
99
-
100
-
101
-
102
-
103
-
104
-
105
-
106
-
107
-
108
-
109
-
 110
110 -
 111
111 -
 112
112 -
 113
113 -
 114
114 -
 115
115 -
 116
116 -
 117
117 -
 118
118 -
 119
119 -
 120
120 -
 121
121 -
 122
122 -
 123
123 -
 124
124 -
 125
125 -
 126
126 -
 127
127 -
 128
128 -
 129
129 -
 130
130 -
131
-
132
-
133
-
134
-
135
-
136
-
137
-
138
-
139
-
140
 |
 |

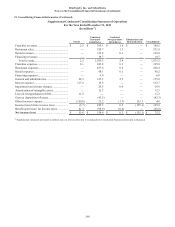
DineEquity, Inc. and Subsidiaries
Notes to the Consolidated Financial Statements (Continued)
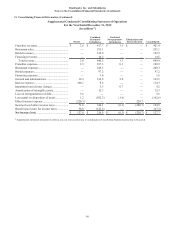
21. Consolidating Financial Information (Continued)
102
Supplemental Condensed Consolidating Statement of Cash Flows
For the Year Ended December 31, 2012
(In millions(1))
Parent
Combined
Guarantor
Subsidiaries
Combined
Non-
guarantor
Subsidiaries Eliminations and
Reclassification Consolidated
Cash flows provided by (used in) operating
activities .......................................................... $ (130.1) $ 182.5 $ 0.4 — $ 52.9
Investing cash flows
Additions to property and equipment .............. (4.9) (12.0) — (17.0)
Principal receipts from long-term receivables. — 12.2 — — 12.3
Proceeds from sale of assets ............................ — 168.9 — — 168.9
Other ................................................................ — 1.2 — — 1.2
Cash flows provided by (used in) investing
activities .......................................................... (4.9) 170.3 — — 165.4
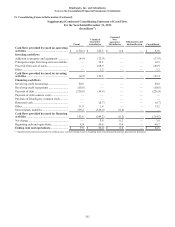
Financing cash flows
Revolving credit borrowings............................ 50.0 — — — 50.0
Revolving credit repayments ........................... (50.0) — — — (50.0)
Payment of debt ............................................... (216.0) (10.9) — — (226.9)
Payment of debt issuance costs........................ — — — — —
Purchase of DineEquity common stock........... — — — — —
Restricted cash ................................................. — (0.7) — — (0.7)
Other ................................................................ 11.8 1.4 — — 13.2
Intercompany transfers..................................... 339.2 (339.0)(0.2) — —
Cash flows provided by (used in) financing
activities .......................................................... 135.0 (349.2)(0.2) — (214.5)
Net change ....................................................... — 3.6 0.2 — 3.8
Beginning cash and equivalents....................... 9.9 50.4 0.4 — 60.7
Ending cash and equivalents......................... $ 9.9 $ 54.0 $ 0.6 — $ 64.5
(1) Supplemental statements presented in millions may not foot/crossfoot due to rounding from Consolidated Statements presented in thousands