HSBC 2013 Annual Report Download - page 99
Download and view the complete annual report
Please find page 99 of the 2013 HSBC annual report below. You can navigate through the pages in the report by either clicking on the pages listed below, or by using the keyword search tool below to find specific information within the annual report.-
 1
1 -
2
-
3
-
4
-
5
-
6
-
7
-
8
-
9
-
10
-
11
-
12
-
13
-
14
-
15
-
16
-
17
-
18
-
19
-
20
-
21
-
22
-
23
-
24
-
25
-
26
-
27
-
28
-
29
-
30
-
31
-
32
-
33
-
34
-
35
-
36
-
37
-
38
-
39
-
40
-
41
-
42
-
43
-
44
-
45
-
46
-
47
-
48
-
49
-
50
-
51
-
52
-
53
-
54
-
55
-
56
-
57
-
58
-
59
-
60
-
61
-
62
-
63
-
64
-
65
-
66
-
67
-
68
-
69
-
70
-
71
-
72
-
73
-
74
-
75
-
76
-
77
-
78
-
79
-
80
-
81
-
82
-
83
-
84
-
85
-
86
-
87
-
88
-
 89
89 -
 90
90 -
 91
91 -
 92
92 -
 93
93 -
 94
94 -
 95
95 -
 96
96 -
 97
97 -
 98
98 -
 99
99 -
 100
100 -
 101
101 -
 102
102 -
 103
103 -
 104
104 -
 105
105 -
 106
106 -
 107
107 -
 108
108 -
 109
109 -
110
-
111
-
112
-
113
-
114
-
115
-
116
-
117
-
118
-
119
-
120
-
121
-
122
-
123
-
124
-
125
-
126
-
127
 |
 |

97
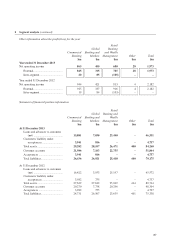
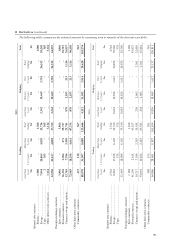
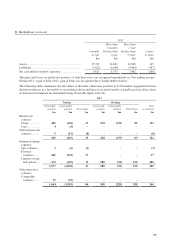
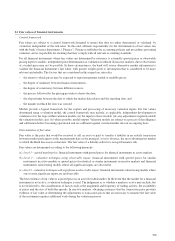
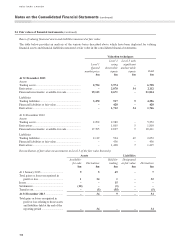
13 Interest rate sensitivity
The following table provides an analysis of the interest rate sensitivity position based on contractual repricing dates of
assets and liabilities.
2013
Floating
rate
$m
Within
3 months
$m
3–12
months
$m
Average
interest rate
%
1–5 years
$m
Average
interest rate
%
Greater
than 5 years
$m
Average
interest rate
%
Non-interest
sensitive
$m
Total
$m
Cash and balances at central
bank ................................. – – – – – 165 165
Items in the course of
collection from other
banks ............................... – – – – – 107 107
Trading assets ........................ 3,880 2,821 27 1.1 – – – 6,728
Derivatives ............................ – – – – – 2,112 2,112
Loans and advances to banks – 938 – 1.0 – – 544 1,482
Loans and advances
to customers .................... 23,913 11,461 2,978 3.1 7,777 3.5 105 4.5 117 46,351
Financial investments ............ – 4,364 3,920 1.5 10,571 1.5 2,959 2.6 – 21,814
Acceptances .......................... – – – – – 4,757 4,757
Other assets ........................... – – – – – 744 744
Total assets ............................ 27,793 19,584 6,925 18,348 3,064 8,546 84,260
Deposits by banks ................. – 722 – 1.0 – – 483 1,205
Customer accounts ................ 26,040 5,640 8,167 1.0 2,969 2.6 – 9,028 51,844
Items in the course of
transmission to other
banks ............................... – – – – – 53 53
Trading liabilities .................. 4,269 – – 1.0 – – 127 4,396
Financial liabilities
designated at fair value ... – – – 428 4.8 – – 428
Derivatives ............................ – – – – – 1,746 1,746
Debt securities in issue .......... – 4,070 1,297 1.7 4,643 3.1 1,338 3.1 – 11,348
Acceptances .......................... – – – – – 4,757 4,757
Subordinated liabilities ......... – 39 – 1.7 200 5.0 – – 239
Other liabilities ...................... – – – – – 3,159 3,159
Shareholders’ equity .............. – – 250 6.6 350 5.1 – 4,285 4,885
Non controlling interest ........ – – – 200 5.2 – – 200
Total liabilities and
shareholders’ equity ........ 30,309 10,471 9,714 8,790 1,338 23,638 84,260
On-balance sheet gap ............ (2,516) 9,113 (2,789) 9,558 1,726 (15,092) –
Off-balance sheet positions ... – 1,696 (1,088) 1,330 (1,938) – –
Total interest rate gap ............ (2,516) 10,809 (3,877) 10,888 (212) (15,092) –