HSBC 2013 Annual Report Download - page 15
Download and view the complete annual report
Please find page 15 of the 2013 HSBC annual report below. You can navigate through the pages in the report by either clicking on the pages listed below, or by using the keyword search tool below to find specific information within the annual report.-
 1
1 -
2
-
3
-
4
-
 5
5 -
 6
6 -
 7
7 -
 8
8 -
 9
9 -
 10
10 -
 11
11 -
 12
12 -
 13
13 -
 14
14 -
 15
15 -
 16
16 -
 17
17 -
 18
18 -
 19
19 -
 20
20 -
 21
21 -
 22
22 -
 23
23 -
 24
24 -
 25
25 -
26
-
27
-
28
-
29
-
30
-
31
-
32
-
33
-
34
-
35
-
36
-
37
-
38
-
39
-
40
-
41
-
42
-
43
-
44
-
45
-
46
-
47
-
48
-
49
-
50
-
51
-
52
-
53
-
54
-
55
-
56
-
57
-
58
-
59
-
60
-
61
-
62
-
63
-
64
-
65
-
66
-
67
-
68
-
69
-
70
-
71
-
72
-
73
-
74
-
75
-
76
-
77
-
78
-
79
-
80
-
81
-
82
-
83
-
84
-
85
-
86
-
87
-
88
-
89
-
90
-
91
-
92
-
93
-
94
-
95
-
96
-
97
-
98
-
99
-
100
-
101
-
102
-
103
-
104
-
105
-
106
-
107
-
108
-
109
-
110
-
111
-
112
-
113
-
114
-
115
-
116
-
117
-
118
-
119
-
120
-
121
-
122
-
123
-
124
-
125
-
126
-
127
 |
 |

13
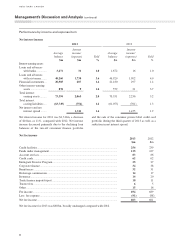
– International trade and receivables finance: we
provide the services and finance our clients need
throughout the trade cycle including; letters of
credit, collections, guarantees; receivables finance;
supply chain solutions; and risk distribution. HSBC
is supporting the development of renminbi as a trade
currency, with renminbi capabilities for exporters,
importers, and companies looking to invest in China.
– Payments and Cash Management: we are a leading
provider of domestic and cross-border payments,
collections, liquidity management and account
services offering local, regional and global solutions
delivered via e-enabled platforms designed to
address the current and future needs of our clients.
– Global Banking and Markets: our Commercial Banking
franchise represents a key client base for Global
Banking and Markets products and services, including
foreign exchange and interest rate products, together
with capital raising on debt and equity markets.
Strategic direction
Commercial Banking aims to be the banking partner of
choice for international businesses by building on our
rich heritage, international capabilities and relationships
to enable connectivity and support trade and capital
flows around the world, thereby strengthening our
leading position in international business and trade.
We have three growth priorities:
– grow coverage in target segments;
– drive revenue growth through our international
network; and
– grow collaboration revenues.
Implementing Global Standards, enhancing risk
management controls models and simplifying processes
also remain top priorities for Commercial Banking.
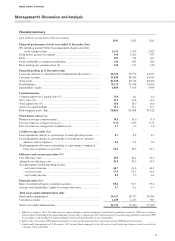
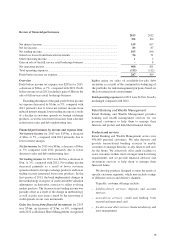
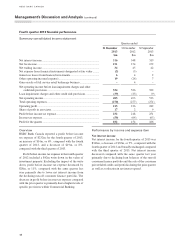
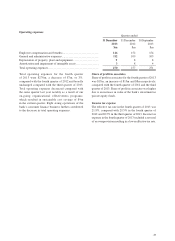
Review of financial performance
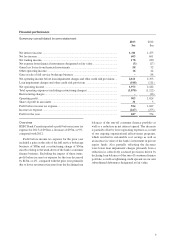
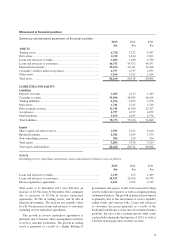
2013
$m
2012
$m
Net interest income ........................................................................................................ 675 710
Net fee income ............................................................................................................... 317 307
Net trading income ......................................................................................................... 28 31
Other operating income/(expense) ................................................................................. (31) (25)
Net operating income before loan impairment charges and other credit risk provisions ... 989 1,023
Loan impairment charges and other credit risk provisions ............................................ (124) (79)
Net operating income ..................................................................................................... 865 944
Total operating expenses ................................................................................................ (373) (377)
Operating profit .............................................................................................................. 492 567
Share of profit in associates ........................................................................................... 31 5
Profit before income tax expense ................................................................................... 523 572
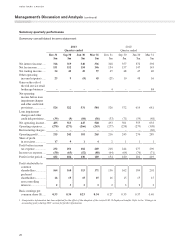
Overview
Profit before income tax expense was $523m for 2013,
a decrease of $49m, or 9%, compared with 2012. Profit
before income tax decreased primarily due to higher
specific loan impairment charges in the energy, real
estate and agriculture sectors as well as lower net interest
income from the narrowing of net interest spread in a
competitive low interest rate environment. The decrease
in profit before tax was partially offset by growth in the
value of the bank’s investment in private equity funds and
higher net fee income as a result of growth in bankers’
acceptances and related transaction volume.
Financial performance by income and expense item
Net interest income for 2013 was $675m, a decrease
of $35m, or 5%, compared with 2012 primarily due to
lower net interest spread in a competitive low interest
rate environment.
Net fee income for 2013 was $317m, an increase of
$10m, or 3%, compared with 2012 primarily as a
result of growth in bankers’ acceptances and related
transaction volume.
Net trading income for 2013 was $28m, a decrease of
$3m, or 10% compared with 2012 primarily due to lower
trading volume related to foreign exchange products.