HSBC 2013 Annual Report Download - page 5
Download and view the complete annual report
Please find page 5 of the 2013 HSBC annual report below. You can navigate through the pages in the report by either clicking on the pages listed below, or by using the keyword search tool below to find specific information within the annual report.-
 1
1 -
 2
2 -
 3
3 -
 4
4 -
 5
5 -
 6
6 -
 7
7 -
 8
8 -
 9
9 -
 10
10 -
 11
11 -
 12
12 -
 13
13 -
 14
14 -
 15
15 -
 16
16 -
17
-
18
-
19
-
20
-
21
-
22
-
23
-
24
-
25
-
26
-
27
-
28
-
29
-
30
-
31
-
32
-
33
-
34
-
35
-
36
-
37
-
38
-
39
-
40
-
41
-
42
-
43
-
44
-
45
-
46
-
47
-
48
-
49
-
50
-
51
-
52
-
53
-
54
-
55
-
56
-
57
-
58
-
59
-
60
-
61
-
62
-
63
-
64
-
65
-
66
-
67
-
68
-
69
-
70
-
71
-
72
-
73
-
74
-
75
-
76
-
77
-
78
-
79
-
80
-
81
-
82
-
83
-
84
-
85
-
86
-
87
-
88
-
89
-
90
-
91
-
92
-
93
-
94
-
95
-
96
-
97
-
98
-
99
-
100
-
101
-
102
-
103
-
104
-
105
-
106
-
107
-
108
-
109
-
110
-
111
-
112
-
113
-
114
-
115
-
116
-
117
-
118
-
119
-
120
-
121
-
122
-
123
-
124
-
125
-
126
-
127
 |
 |

HSBC BANK CANADAHSBC BANK CANADA
3
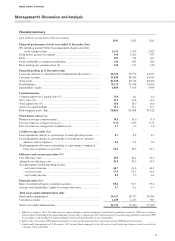
Management’s Discussion and Analysis (continued)
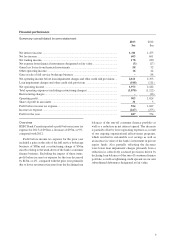
Financial summary
(in $ millions, except where otherwise stated)
2013 2012 2011
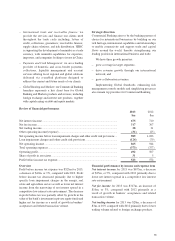
Financial performance for the year ended 31 December ($m)
Net operating income before loan impairment charges and other
credit risk provisions ............................................................................ 2,161 2,393 2,422
Profit before income tax expense ................................................................. 934 1,029 947
Profit ............................................................................................................ 687 754 697
Profit attributable to common shareholders ................................................. 616 683 626
Basic earnings per common share ($) .......................................................... 1.24 1.37 1.26
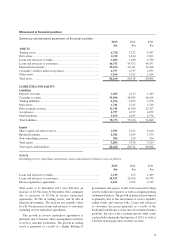
Financial position at 31 December ($m)
Loans and advances to customers (net of impairment allowances) ............. 46,351 45,572 44,357
Customer accounts ....................................................................................... 51,844 48,304 46,614
Total assets ................................................................................................... 84,260 80,714 80,068
Total liabilities ............................................................................................. 79,175 75,338 74,849
Shareholders’ equity ..................................................................................... 4,885 5,146 4,989
Capital measures1
Common equity tier 1 capital ratio (%) ....................................................... 11.0 n/a n/a
Tier 1 ratio (%) ............................................................................................. 13.2 13.8 13.4
Total capital ratio (%) .................................................................................. 15.0 16.0 16.0
Assets-to-capital multiple ............................................................................ 15.1 13.1 13.1
Risk-weighted assets ($m) ........................................................................... 36,862 36,668 35,322
Performance ratios (%)2
Return on average common equity .............................................................. 14.5 16.6 17.0
Post-tax return on average total assets ......................................................... 0.72 0.83 0.77
Post-tax return on average risk-weighted assets1 ......................................... 1.7 1.9 1.8
Credit coverage ratios (%)2
Loan impairment charges as a percentage of total operating income .......... 8.7 8.8 8.1
Loan impairment charges as a percentage of average gross customer
advances and acceptances ...................................................................... 0.4 0.4 0.4
Total impairment allowances outstanding as a percentage of impaired
loans and acceptances at year end ......................................................... 64.2 48.8 61.3
Efficiency and revenue mix ratios (%)2
Cost efficiency ratio ..................................................................................... 49.5 48.4 52.9
Adjusted cost efficiency ratio ...................................................................... 49.4 47.9 52.9
As a percentage of total operating income:
– net interest income .............................................................................. 60.7 61.6 64.2
– net fee income ..................................................................................... 27.9 25.1 26.6
– net trading income .............................................................................. 8.2 7.5 6.2
Financial ratios (%)2
Ratio of customer advances to customer accounts .............................................. 89.4 94.3 95.2
Average total shareholders’ equity to average total assets ........................... 5.7 6.1 5.7
Total assets under administration ($m)2
Funds under management3 ........................................................................... 20,167 18,327 26,383
Custodial accounts ....................................................................................... 1,209 1,133 967
Total assets under administration ................................................................. 21,376 19,460 27,350
1 Effective 1 January 2013, the bank assesses capital adequacy against standards established in guidelines issued by OSFI in accordance
with the Basel II and Basel III capital adequacy frameworks. Comparative 2012 information is presented using guidelines issued by OSFI
in accordance with the Basel II capital adequacy framework and therefore is not comparable.
2 Refer to the ‘Use of non-IFRS financial measures’ section of this document for a discussion of non-IFRS financial measures.
3 Funds under management at 31 December 2011 include funds managed in the full service retail brokerage business which was sold on
1 January 2012 of $10.6bn.