HSBC 2013 Annual Report Download - page 108
Download and view the complete annual report
Please find page 108 of the 2013 HSBC annual report below. You can navigate through the pages in the report by either clicking on the pages listed below, or by using the keyword search tool below to find specific information within the annual report.-
 1
1 -
2
-
3
-
4
-
5
-
6
-
7
-
8
-
9
-
10
-
11
-
12
-
13
-
14
-
15
-
16
-
17
-
18
-
19
-
20
-
21
-
22
-
23
-
24
-
25
-
26
-
27
-
28
-
29
-
30
-
31
-
32
-
33
-
34
-
35
-
36
-
37
-
38
-
39
-
40
-
41
-
42
-
43
-
44
-
45
-
46
-
47
-
48
-
49
-
50
-
51
-
52
-
53
-
54
-
55
-
56
-
57
-
58
-
59
-
60
-
61
-
62
-
63
-
64
-
65
-
66
-
67
-
68
-
69
-
70
-
71
-
72
-
73
-
74
-
75
-
76
-
77
-
78
-
79
-
80
-
81
-
82
-
83
-
84
-
85
-
86
-
87
-
88
-
89
-
90
-
91
-
92
-
93
-
94
-
95
-
96
-
97
-
 98
98 -
 99
99 -
 100
100 -
 101
101 -
 102
102 -
 103
103 -
 104
104 -
 105
105 -
 106
106 -
 107
107 -
 108
108 -
 109
109 -
 110
110 -
 111
111 -
 112
112 -
 113
113 -
 114
114 -
 115
115 -
 116
116 -
 117
117 -
 118
118 -
119
-
120
-
121
-
122
-
123
-
124
-
125
-
126
-
127
 |
 |

HSBC BANK CANADA
106
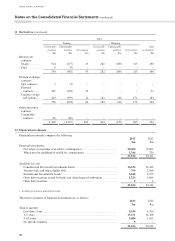
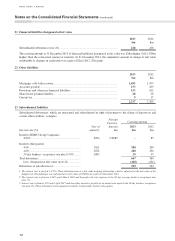
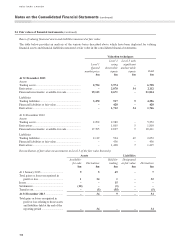
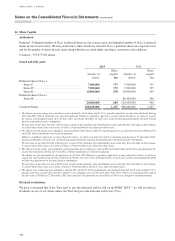
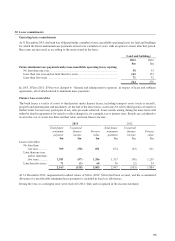
24 Fair values of financial instruments (continued)
Bases of valuing financial assets and liabilities measured at fair value
The table below provides an analysis of the various bases described above which have been deployed for valuing
financial assets and financial liabilities measured at fair value in the consolidated financial statements.
Valuation techniques
Level 1
Quoted
market price
$m
Level 2
using
observable
inputs
$m
Level 3 with
significant
unobservable
inputs
$m
Total
$m
At 31 December 2013
Assets
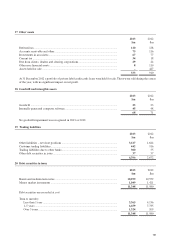
Trading assets .............................................................. 2,754 3,974 – 6,728
Derivatives .................................................................. – 2,078 34 2,112
Financial investments: available-for-sale.................... 19,143 2,671 – 21,814
Liabilities
Trading liabilities ........................................................ 3,470 917 9 4,396
Financial liabilities at fair value .................................. – 428 – 428
Derivatives .................................................................. – 1,712 34 1,746
At 31 December 2012
Assets
Trading assets .............................................................. 2,292 2,980 – 5,272
Derivatives .................................................................. – 1,805 5 1,810
Financial investments: available-for-sale.................... 17,705 2,697 9 20,411
Liabilities
Trading liabilities ........................................................ 2,119 504 49 2,672
Financial liabilities at fair value .................................. – 436 – 436
Derivatives .................................................................. – 1,408 7 1,415
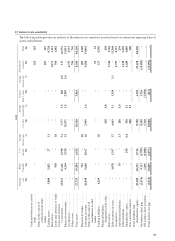
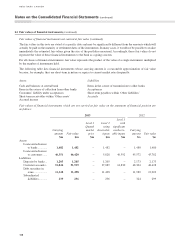
Reconciliation of fair value measurements in Level 3 of the fair value hierarchy
Assets Liabilities
Available-
for-sale
$m
Derivatives
$m
Held for
trading
$m
Designated
at fair value
$m
Derivatives
$m
At 1 January 2013 ............................... 9 5 49 – 7
Total gains or losses recognized in
profit or loss .................................. 1 34 1 – 32
Issues ................................................... – – 15 – –
Settlements .......................................... (10) – (1) – –
Transfer out ......................................... – (5) (55) – (5)
At 31 December 2013 ......................... – 34 9 – 34
Total gains or losses recognized in
profit or loss relating to those assets
and liabilities held at the end of the
reporting period ................................ – 34 – – 34
Notes on the Consolidated Financial Statements (continued)