HSBC 2013 Annual Report Download - page 93
Download and view the complete annual report
Please find page 93 of the 2013 HSBC annual report below. You can navigate through the pages in the report by either clicking on the pages listed below, or by using the keyword search tool below to find specific information within the annual report.-
 1
1 -
2
-
3
-
4
-
5
-
6
-
7
-
8
-
9
-
10
-
11
-
12
-
13
-
14
-
15
-
16
-
17
-
18
-
19
-
20
-
21
-
22
-
23
-
24
-
25
-
26
-
27
-
28
-
29
-
30
-
31
-
32
-
33
-
34
-
35
-
36
-
37
-
38
-
39
-
40
-
41
-
42
-
43
-
44
-
45
-
46
-
47
-
48
-
49
-
50
-
51
-
52
-
53
-
54
-
55
-
56
-
57
-
58
-
59
-
60
-
61
-
62
-
63
-
64
-
65
-
66
-
67
-
68
-
69
-
70
-
71
-
72
-
73
-
74
-
75
-
76
-
77
-
78
-
79
-
80
-
81
-
82
-
 83
83 -
 84
84 -
 85
85 -
 86
86 -
 87
87 -
 88
88 -
 89
89 -
 90
90 -
 91
91 -
 92
92 -
 93
93 -
 94
94 -
 95
95 -
 96
96 -
 97
97 -
 98
98 -
 99
99 -
 100
100 -
 101
101 -
 102
102 -
 103
103 -
104
-
105
-
106
-
107
-
108
-
109
-
110
-
111
-
112
-
113
-
114
-
115
-
116
-
117
-
118
-
119
-
120
-
121
-
122
-
123
-
124
-
125
-
126
-
127
 |
 |

91
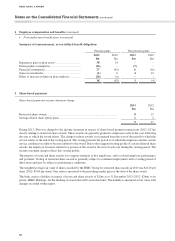
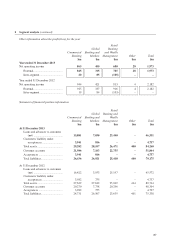
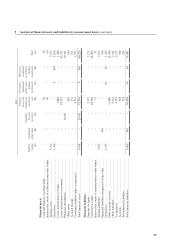
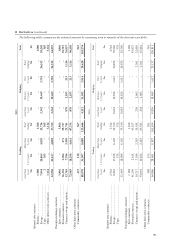
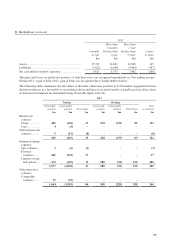
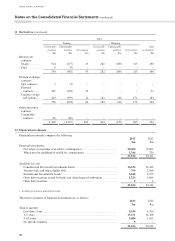
11 Derivatives (continued)
The following tables summarize the notional amounts by remaining term to maturity of the derivative portfolio.
2013
Trading Hedging Total
Less than
1 year
$m
1 to 5 years
$m
More than
5 years
$m
Total
trading
$m
Less than
1 year
$m
Between
1–5 years
$m
Over
5 years
$m
Total
hedging
$m $m
Interest rate contracts
Futures ........................................... 1,580 – – 1,580 – – – – 1,580
Swaps ............................................ 7,844 20,864 4,028 32,736 3,342 19,469 3,701 26,512 59,248
Caps ............................................... 2 303 – 305 – – – – 305
Other interest rate contracts .......... 3,124 – – 3,124 – – – – 3,124
12,550 21,167 4,028 37,745 3,342 19,469 3,701 26,512 64,257
Foreign exchange contracts
Spot contracts ................................ 3,866 – – 3,866 – – – – 3,866
Forward contracts .......................... 56,352 2,904 471 59,727 – – – – 59,727
Currency swaps and options ......... 12,765 7,386 3,590 23,741 870 2,033 213 3,116 26,857
72,983 10,290 4,061 87,334 870 2,033 213 3,116 90,450
Other derivative contracts
Commodity contracts .................... 437 130 – 567 – – – – 567
85,970 31,587 8,089 125,646 4,212 21,502 3,914 29,628 155,274
2012
Trading Hedging Total
Less than
1 year
$m 1 to 5 years
$m
More than
5 years
$m
Total
trading
$m
Less than
1 year
$m
Between
1–5 years
$m
Over
5 years
$m
Total
hedging
$m $m
Interest rate contracts
Futures ........................................... 2,542 – – 2,542 – – – – 2,542
Swaps ............................................ 8,862 17,426 6,102 32,390 8,618 16,626 1,612 26,856 59,246
Caps ............................................... – 578 – 578 – – – – 578
11,404 18,004 6,102 35,510 8,618 16,626 1,612 26,856 62,366
Foreign exchange contracts
Spot contracts ................................ 1,168 – – 1,168 – – – – 1,168
Forward contracts .......................... 41,209 2,618 – 43,827 – – – – 43,827
Currency swaps and options ......... 10,717 7,586 2,285 20,588 238 2,063 – 2,301 22,889
53,094 10,204 2,285 65,583 238 2,063 – 2,301 67,884
Other derivative contracts
Commodity contracts .................... 368 193 – 561 – – – – 561
64,866 28,401 8,387 101,654 8,856 18,689 1,612 29,157 130,811