HSBC 2013 Annual Report Download - page 24
Download and view the complete annual report
Please find page 24 of the 2013 HSBC annual report below. You can navigate through the pages in the report by either clicking on the pages listed below, or by using the keyword search tool below to find specific information within the annual report.-
 1
1 -
2
-
3
-
4
-
5
-
6
-
7
-
8
-
9
-
10
-
11
-
12
-
13
-
 14
14 -
 15
15 -
 16
16 -
 17
17 -
 18
18 -
 19
19 -
 20
20 -
 21
21 -
 22
22 -
 23
23 -
 24
24 -
 25
25 -
 26
26 -
 27
27 -
 28
28 -
 29
29 -
 30
30 -
 31
31 -
 32
32 -
 33
33 -
 34
34 -
35
-
36
-
37
-
38
-
39
-
40
-
41
-
42
-
43
-
44
-
45
-
46
-
47
-
48
-
49
-
50
-
51
-
52
-
53
-
54
-
55
-
56
-
57
-
58
-
59
-
60
-
61
-
62
-
63
-
64
-
65
-
66
-
67
-
68
-
69
-
70
-
71
-
72
-
73
-
74
-
75
-
76
-
77
-
78
-
79
-
80
-
81
-
82
-
83
-
84
-
85
-
86
-
87
-
88
-
89
-
90
-
91
-
92
-
93
-
94
-
95
-
96
-
97
-
98
-
99
-
100
-
101
-
102
-
103
-
104
-
105
-
106
-
107
-
108
-
109
-
110
-
111
-
112
-
113
-
114
-
115
-
116
-
117
-
118
-
119
-
120
-
121
-
122
-
123
-
124
-
125
-
126
-
127
 |
 |

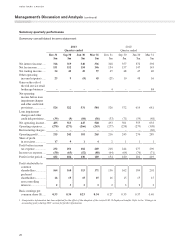
Summary quarterly performance
Summary consolidated income statement
2013 20121
Quarter ended Quarter ended
Dec 31
$m
Sep 30
$m
Jun 30
$m
Mar 31
$m
Dec 31
$m
Sep 30
$m Jun 30
$m Mar 31
$m
Net interest income ..... 316 319 340 336 348 357 372 398
Net fee income ............ 151 152 154 146 154 157 147 143
Net trading income ...... 34 42 45 57 45 48 47 40
Other operating
income/(expense) ..... 23 9 (8) 45 (25) 10 48 16
Gain on the sale of
the full service retail
brokerage business ... – – – – 4 – – 84
Net operating
income before loan
impairment charges
and other credit risk
provisions .................. 524 522 531 584 526 572 614 681
Loan impairment
charges and other
credit risk provisions ... (39) (9) (84) (56) (33) (71) (59) (48)
Net operating income .. 485 513 447 528 493 501 555 633
Operating expenses ..... (270) (271) (266) (263) (277) (258) (279) (308)
Restructuring charges .. – – – – – – – (36)
Operating profit ........... 215 242 181 265 216 243 276 289
Share of profit
in associates ............... 17 9 1 4 2 1 1 1
Profit before income
tax expense ............... 232 251 182 269 218 244 277 290
Income tax expense ..... (50) (65) (52) (80) (64) (64) (76) (71)
Profit for the period ..... 182 186 130 189 154 180 201 219
Profit attributable to:
common
shareholders .............. 164 168 113 171 136 162 184 201
preferred
shareholders .............. 16 15 15 15 16 15 15 15
non-controlling
interests ..................... 23232323
Basic earnings per
common share ($) ..... 0.33 0.34 0.23 0.34 0.27 0.33 0.37 0.40
1 Comparative information has been adjusted for the effect of the adoption of the revised IAS 19 Employee benefits. Refer to the ‘Changes in
accounting policy during 2013’ section for further information.
HSBC BANK CANADA
Management’s Discussion and Analysis (continued)
22