HSBC 2013 Annual Report Download - page 83
Download and view the complete annual report
Please find page 83 of the 2013 HSBC annual report below. You can navigate through the pages in the report by either clicking on the pages listed below, or by using the keyword search tool below to find specific information within the annual report.-
 1
1 -
2
-
3
-
4
-
5
-
6
-
7
-
8
-
9
-
10
-
11
-
12
-
13
-
14
-
15
-
16
-
17
-
18
-
19
-
20
-
21
-
22
-
23
-
24
-
25
-
26
-
27
-
28
-
29
-
30
-
31
-
32
-
33
-
34
-
35
-
36
-
37
-
38
-
39
-
40
-
41
-
42
-
43
-
44
-
45
-
46
-
47
-
48
-
49
-
50
-
51
-
52
-
53
-
54
-
55
-
56
-
57
-
58
-
59
-
60
-
61
-
62
-
63
-
64
-
65
-
66
-
67
-
68
-
69
-
70
-
71
-
72
-
 73
73 -
 74
74 -
 75
75 -
 76
76 -
 77
77 -
 78
78 -
 79
79 -
 80
80 -
 81
81 -
 82
82 -
 83
83 -
 84
84 -
 85
85 -
 86
86 -
 87
87 -
 88
88 -
 89
89 -
 90
90 -
 91
91 -
 92
92 -
 93
93 -
94
-
95
-
96
-
97
-
98
-
99
-
100
-
101
-
102
-
103
-
104
-
105
-
106
-
107
-
108
-
109
-
110
-
111
-
112
-
113
-
114
-
115
-
116
-
117
-
118
-
119
-
120
-
121
-
122
-
123
-
124
-
125
-
126
-
127
 |
 |

81
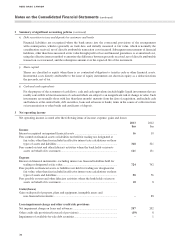
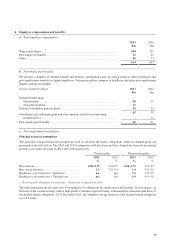
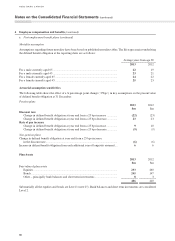
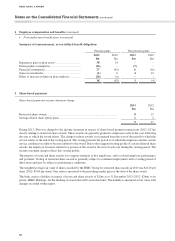
4 Employee compensation and benefits (continued)
c Post-employment benefit plans (continued)
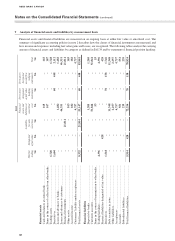
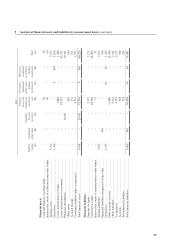
Fair value of plan assets and present value of defined benefit obligations
Pension plans Non-pension plans
2013
$m
2012
$m 2013
$m
2012
$m
Fair value of plan assets
At 1 January ................................................................ 410 388 ––
Interest on plan assets ................................................. 18 19 ––
Contributions by the bank ........................................... 45 30 41
Contributions by employees ....................................... 11––
Experience gains ......................................................... 38 14 ––
Benefits paid ............................................................... (25) (36) (4) 3
Non-investment expenses ........................................... (1) (1) ––
Distributed on settlements ........................................... –(5) –(4)
At 31 December .......................................................... 486 410 ––
Present value of defined benefit obligations
At 1 January ................................................................ (566) (517) (152) (150)
Current service cost ..................................................... (13) (13) (5) (5)
Interest cost ................................................................. (24) (25) (7) (8)
Contributions by employees ....................................... (1) (1) ––
Actuarial gains/(losses) arising from changes in:
– Demographic assumptions ................................. (26) –(7) –
– Financial assumptions ........................................ 27 (61) 6(16)
– Experience adjustments ..................................... (1) 6412
Benefits paid ............................................................... 25 36 44
Special contractual benefits ........................................ –(2) ––
Liabilities extinguished on curtailments and settlements –11 –11
At 31 December .......................................................... (579) (566) (157) (152)
Funded ................................................................... (523) (511) ––
Unfunded ............................................................... (56) (55) (157) (152)
Other – effect of limit on plan surpluses ..................... (21) (1) ––
Net liability ................................................................. (114) (157) (157) (152)
The actual return on plan assets for the year ended 31 December 2013 was a return of $56m (2012: $33m).
Actuarial valuations for the bank’s pension plans are prepared annually and for non-pension arrangements triennially.
The most recent actuarial valuations of the defined benefit pension plans for funding purposes were conducted as at
31 December 2012 and the most recent actuarial valuation of the non-pension arrangements was as at 1 July 2012. Based
on the most recent valuations of the plans, the bank expects to make $32m of contributions to defined benefit pension
plans during 2014.
The defined benefit pension plans expose the bank to risks, including: interest rate risk to the extent that the assets are not
invested in bonds that match the plans’ obligations, general market risk in respect of its equity investments, and longevity
risk in respect of pensioners and beneficiaries living longer than assumed. These risks would be realized through higher
pension costs and a higher defined benefit liability.
The bank takes steps to manage these risks through an asset liability management program, which includes reducing interest
rate and market risk over time by increasing its asset allocation to bonds that more closely match the plan’s obligations.