HSBC 2013 Annual Report Download - page 89
Download and view the complete annual report
Please find page 89 of the 2013 HSBC annual report below. You can navigate through the pages in the report by either clicking on the pages listed below, or by using the keyword search tool below to find specific information within the annual report.-
 1
1 -
2
-
3
-
4
-
5
-
6
-
7
-
8
-
9
-
10
-
11
-
12
-
13
-
14
-
15
-
16
-
17
-
18
-
19
-
20
-
21
-
22
-
23
-
24
-
25
-
26
-
27
-
28
-
29
-
30
-
31
-
32
-
33
-
34
-
35
-
36
-
37
-
38
-
39
-
40
-
41
-
42
-
43
-
44
-
45
-
46
-
47
-
48
-
49
-
50
-
51
-
52
-
53
-
54
-
55
-
56
-
57
-
58
-
59
-
60
-
61
-
62
-
63
-
64
-
65
-
66
-
67
-
68
-
69
-
70
-
71
-
72
-
73
-
74
-
75
-
76
-
77
-
78
-
 79
79 -
 80
80 -
 81
81 -
 82
82 -
 83
83 -
 84
84 -
 85
85 -
 86
86 -
 87
87 -
 88
88 -
 89
89 -
 90
90 -
 91
91 -
 92
92 -
 93
93 -
 94
94 -
 95
95 -
 96
96 -
 97
97 -
 98
98 -
 99
99 -
100
-
101
-
102
-
103
-
104
-
105
-
106
-
107
-
108
-
109
-
110
-
111
-
112
-
113
-
114
-
115
-
116
-
117
-
118
-
119
-
120
-
121
-
122
-
123
-
124
-
125
-
126
-
127
 |
 |

87
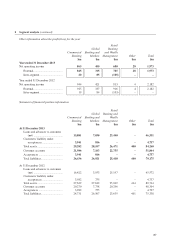
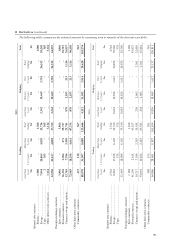
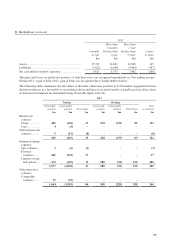
8 Segment analysis (continued)
Other information about the profit/(loss) for the year
Commercial
Banking
$m
Global
Banking and
Markets
$m
Retail
Banking
and Wealth
Management
$m
Other
$m
Total
$m
Year ended 31 December 2013
Net operating income 865 400 680 28 1,973
External ........................................ 845 315 785 28 1,973
Inter-segment ............................... 20 85 (105) – –
Year ended 31 December 2012
Net operating income 944 421 813 4 2,182
External ........................................ 925 337 916 4 2,182
Inter-segment ............................... 19 84 (103) – –
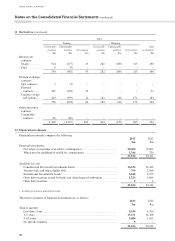
Statement of financial position information
Commercial
Banking
$m
Global
Banking and
Markets
$m
Retail
Banking and
Wealth
Management
$m
Other
$m
Total
$m
At 31 December 2013
Loans and advances to customers
(net) .......................................... 15,881 7,030 23,440 – 46,351
Customers’ liability under
acceptances............................. 3,941 816 – – 4,757
Total assets ................................... 29,282 28,107 26,471 400 84,260
Customer accounts 21,986 7,103 22,755 – 51,844
Acceptances ................................. 3,941 816 – – 4,757
Total liabilities.............................. 26,436 26,921 25,418 400 79,175
At 31 December 2012
Loans and advances to customers
(net) .......................................... 16,422 3,953 25,197 – 45,572
Customers’ liability under
acceptances............................. 3,982 755 – – 4,737
Total assets ................................... 27,639 27,612 25,049 414 80,714
Customer accounts 20,270 7,738 20,296 – 48,304
Acceptances ................................. 3,982 755 – – 4,737
Total liabilities.............................. 24,731 26,567 23,639 401 75,338