HSBC 2013 Annual Report Download - page 92
Download and view the complete annual report
Please find page 92 of the 2013 HSBC annual report below. You can navigate through the pages in the report by either clicking on the pages listed below, or by using the keyword search tool below to find specific information within the annual report.-
 1
1 -
2
-
3
-
4
-
5
-
6
-
7
-
8
-
9
-
10
-
11
-
12
-
13
-
14
-
15
-
16
-
17
-
18
-
19
-
20
-
21
-
22
-
23
-
24
-
25
-
26
-
27
-
28
-
29
-
30
-
31
-
32
-
33
-
34
-
35
-
36
-
37
-
38
-
39
-
40
-
41
-
42
-
43
-
44
-
45
-
46
-
47
-
48
-
49
-
50
-
51
-
52
-
53
-
54
-
55
-
56
-
57
-
58
-
59
-
60
-
61
-
62
-
63
-
64
-
65
-
66
-
67
-
68
-
69
-
70
-
71
-
72
-
73
-
74
-
75
-
76
-
77
-
78
-
79
-
80
-
81
-
 82
82 -
 83
83 -
 84
84 -
 85
85 -
 86
86 -
 87
87 -
 88
88 -
 89
89 -
 90
90 -
 91
91 -
 92
92 -
 93
93 -
 94
94 -
 95
95 -
 96
96 -
 97
97 -
 98
98 -
 99
99 -
 100
100 -
 101
101 -
 102
102 -
103
-
104
-
105
-
106
-
107
-
108
-
109
-
110
-
111
-
112
-
113
-
114
-
115
-
116
-
117
-
118
-
119
-
120
-
121
-
122
-
123
-
124
-
125
-
126
-
127
 |
 |

HSBC BANK CANADA
90
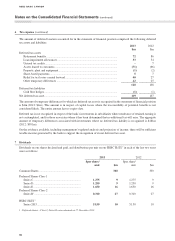
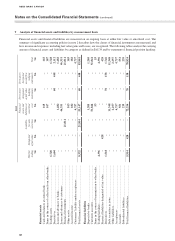
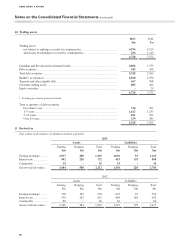
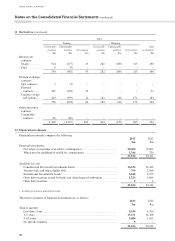
10 Trading assets
2013
$m
2012
$m
Trading assets:
not subject to repledge or resale by counterparties .................................................. 6,294 4,123
which may be repledged or resold by counterparties ............................................... 434 1,149
6,728 5,272
Canadian and Provincial Government bonds1 ................................................................ 2,086 1,753
Debt securities ................................................................................................................ 442 339
Total debt securities ....................................................................................................... 2,528 2,092
Bankers’ acceptances ..................................................................................................... 2,848 2,590
Treasury and other eligible bills ..................................................................................... 467 308
Customer trading assets ................................................................................................. 885 262
Equity securities ............................................................................................................. –20
6,728 5,272
1 Including government guaranteed bonds
Term to maturity of debt securities
Less than 1 year ...................................................................................................... 216 301
1–5 years ................................................................................................................. 1,422 1,255
5–10 years ............................................................................................................... 651 291
Over 10 years ........................................................................................................... 239 245
2,528 2,092
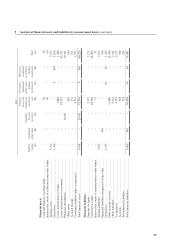
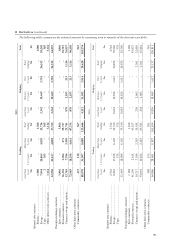
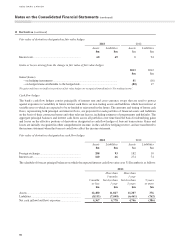
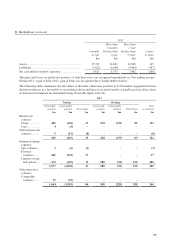
11 Derivatives
Fair values of derivatives by product contract type held
2013
Assets Liabilities
Trading
$m
Hedging
$m
Total
$m
Trading
$m
Hedging
$m
Total
$m
Foreign exchange .......... 1,077 288 1,365 1,030 93 1,123
Interest rate .................... 492 220 712 453 135 588
Commodity ................... 35 – 35 35 – 35
Gross total fair values ... 1,604 508 2,112 1,518 228 1,746
2012
Assets Liabilities
Trading
$m Hedging
$m Total
$m Trading
$m Hedging
$m Total
$m
Foreign exchange .......... 756 182 938 693 10 703
Interest rate .................... 530 282 812 484 168 652
Commodity ................... 60 – 60 60 – 60
Gross total fair values ... 1,346 464 1,810 1,237 178 1,415
Notes on the Consolidated Financial Statements (continued)
HSBC BANK CANADA