HSBC 2013 Annual Report Download - page 37
Download and view the complete annual report
Please find page 37 of the 2013 HSBC annual report below. You can navigate through the pages in the report by either clicking on the pages listed below, or by using the keyword search tool below to find specific information within the annual report.-
 1
1 -
2
-
3
-
4
-
5
-
6
-
7
-
8
-
9
-
10
-
11
-
12
-
13
-
14
-
15
-
16
-
17
-
18
-
19
-
20
-
21
-
22
-
23
-
24
-
25
-
26
-
 27
27 -
 28
28 -
 29
29 -
 30
30 -
 31
31 -
 32
32 -
 33
33 -
 34
34 -
 35
35 -
 36
36 -
 37
37 -
 38
38 -
 39
39 -
 40
40 -
 41
41 -
 42
42 -
 43
43 -
 44
44 -
 45
45 -
 46
46 -
 47
47 -
48
-
49
-
50
-
51
-
52
-
53
-
54
-
55
-
56
-
57
-
58
-
59
-
60
-
61
-
62
-
63
-
64
-
65
-
66
-
67
-
68
-
69
-
70
-
71
-
72
-
73
-
74
-
75
-
76
-
77
-
78
-
79
-
80
-
81
-
82
-
83
-
84
-
85
-
86
-
87
-
88
-
89
-
90
-
91
-
92
-
93
-
94
-
95
-
96
-
97
-
98
-
99
-
100
-
101
-
102
-
103
-
104
-
105
-
106
-
107
-
108
-
109
-
110
-
111
-
112
-
113
-
114
-
115
-
116
-
117
-
118
-
119
-
120
-
121
-
122
-
123
-
124
-
125
-
126
-
127
 |
 |

35
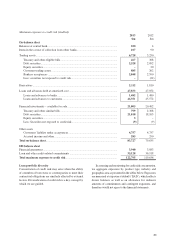
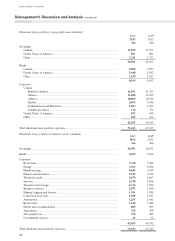
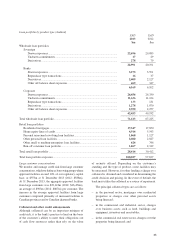
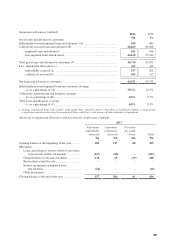
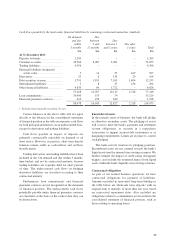
Loan portfolio by product type (Audited) EAD
2013
$m
EAD
2012
$m
Wholesale loan portfolios
Sovereign
Drawn exposures ................................................................................................ 22,696 20,083
Undrawn commitments ...................................................................................... 17 29
Derivatives ......................................................................................................... 278 79
22,991 20,191
Banks
Drawn exposures ................................................................................................ 3,275 3,591
Repurchase type transactions ............................................................................. 16 37
Derivatives ......................................................................................................... 2,409 2,127
Other off-balance sheet exposures ..................................................................... 469 347
6,169 6,102
Corporate
Drawn exposures ................................................................................................ 26,456 26,330
Undrawn commitments ...................................................................................... 11,636 11,124
Repurchase type transactions ............................................................................. 133 131
Derivatives ......................................................................................................... 1,278 1,070
Other off-balance sheet exposures ..................................................................... 2,950 2,277
42,453 40,932
Total wholesale loan portfolio........................................................................................ 71,613 67,225
Retail loan portfolios
Residential mortgages .............................................................................................. 17,347 17,850
Home equity lines of credit ...................................................................................... 4,916 5,543
Personal unsecured revolving loan facilities ............................................................ 1,060 1,127
Other personal loan facilities ................................................................................... 2,600 2,827
Other small to medium enterprises loan facilities .................................................... 624 746
Run-off consumer loan portfolio .............................................................................. 1,867 2,319
Total retail loan portfolio ............................................................................................... 28,414 30,412
Total loan portfolio exposure ......................................................................................... 100,027 97,637
Large customer concentrations
We monitor and manage credit risk from large customer
concentrations, which we define as borrowing groups where
approved facilities exceed 10% of our regulatory capital
base, or $553m at 31 December 2013 (2012: $588m).
At 31 December 2013, the aggregate approved facilities
from large customers was $22,143m (2012: $16,474m),
an average of $963m (2012: $867m) per customer. The
increase in the average approved facilities from large
customers comprised primarily of increased facilities to
Canadian provinces and to Canadian chartered banks.
Collateral and other credit enhancements
Although collateral can be an important mitigant of
credit risk, it is the bank’s practice to lend on the basis
of the customer’s ability to meet their obligations out
of cash flow resources rather than rely on the value
of security offered. Depending on the customer’s
standing and the type of product, some facilities may
be unsecured. However, for other lending a charge over
collateral is obtained and considered in determining the
credit decision and pricing. In the event of default, the
bank may utilize the collateral as a source of repayment.
The principal collateral types are as follows:
– in the personal sector, mortgages over residential
properties or charges over other personal assets
being financed;
– in the commercial and industrial sector, charges
over business assets such as land, buildings and
equipment, inventory and receivables;
– in the commercial real estate sector, charges over the
properties being financed; and