HSBC 2013 Annual Report Download - page 11
Download and view the complete annual report
Please find page 11 of the 2013 HSBC annual report below. You can navigate through the pages in the report by either clicking on the pages listed below, or by using the keyword search tool below to find specific information within the annual report.-
 1
1 -
 2
2 -
 3
3 -
 4
4 -
 5
5 -
 6
6 -
 7
7 -
 8
8 -
 9
9 -
 10
10 -
 11
11 -
 12
12 -
 13
13 -
 14
14 -
 15
15 -
 16
16 -
 17
17 -
 18
18 -
 19
19 -
 20
20 -
 21
21 -
 22
22 -
23
-
24
-
25
-
26
-
27
-
28
-
29
-
30
-
31
-
32
-
33
-
34
-
35
-
36
-
37
-
38
-
39
-
40
-
41
-
42
-
43
-
44
-
45
-
46
-
47
-
48
-
49
-
50
-
51
-
52
-
53
-
54
-
55
-
56
-
57
-
58
-
59
-
60
-
61
-
62
-
63
-
64
-
65
-
66
-
67
-
68
-
69
-
70
-
71
-
72
-
73
-
74
-
75
-
76
-
77
-
78
-
79
-
80
-
81
-
82
-
83
-
84
-
85
-
86
-
87
-
88
-
89
-
90
-
91
-
92
-
93
-
94
-
95
-
96
-
97
-
98
-
99
-
100
-
101
-
102
-
103
-
104
-
105
-
106
-
107
-
108
-
109
-
110
-
111
-
112
-
113
-
114
-
115
-
116
-
117
-
118
-
119
-
120
-
121
-
122
-
123
-
124
-
125
-
126
-
127
 |
 |

9
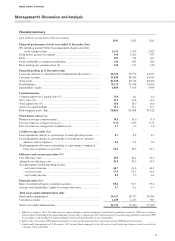
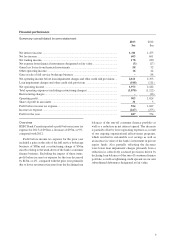
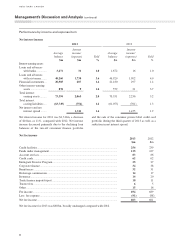
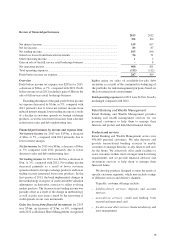
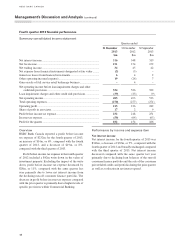
Net trading income
2013
$m
2012
$m
Trading activities ............................................................................................................ 129 138
Net interest from trading activities ................................................................................ 43 37
Hedge ineffectiveness .................................................................................................... 65
Net trading income ......................................................................................................... 178 180
Net trading income for 2013 was $178m, marginally lower compared with 2012.
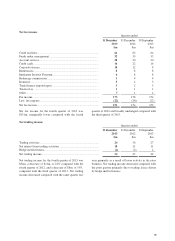
Other items of income
2013
$m
2012
$m
Net expense from financial instruments designated at fair value .................................. (5) (27)
Gains less losses from financial investments ................................................................. 58 52
Other operating income .................................................................................................. 16 24
Gain on the sale of the full service retail brokerage business ........................................ –88
Other items of income .................................................................................................... 69 137
Net expense from financial instruments designated at
fair value for 2013 was a loss of $5m compared with a
loss of $27m in 2012. The bank’s financial instruments
designated at fair value are fixed-rate long-term
subordinated debt issued, the rate profile of which has
been changed to floating through interest rate swaps as
part of a documented interest rate management strategy.
The movement in fair value of these long-term debt
issues and the related hedges includes the effect of our
credit spread changes and any ineffectiveness in the
economic relationship between the related swaps and
own debt. As credit spreads widen or narrow, accounting
profits or losses, respectively, are booked. We reported
net expense from financial instruments in both the current
and last year primarily as a result of adverse fair value
movements driven by the tightening of credit spreads.
Gains less losses from financial investments for 2013
were $58m, an increase of $6m, or 12%, compared with
2012 as Balance Sheet Management recognized higher
gains on sales of available-for-sale debt securities as a
result of the continued re-balancing of the portfolio for
risk management purposes based on the low interest rate
environment.
Other operating income for 2013 was $16m, a
decrease of $8m, or 33% compared with 2012. The
decrease is primarily due to a reduction in fair value of
an investment property sold during 2013.
Gain on the sale of the full service retail brokerage
business. The sale of the full service retail brokerage
business resulted in a gain of $88m, net of assets written
off and directly related costs, and was reported in the
results of 2012.
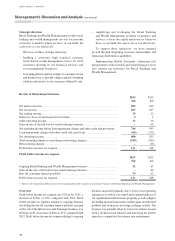
Loan impairment charges and other credit risk provisions
2013
$m
2012
$m
Individually assessed allowances ................................................................................... 138 103
Collectively assessed allowances ................................................................................... 69 99
Loan impairment charges ............................................................................................... 207 202
Impairment of available-for-sale debt securities ............................................................ –1
Other credit risk provisions (reversal of provisions) ..................................................... (19) 8
Loan impairment charges and other credit risk provisions ............................................ 188 211
Loan impairment charges and other credit risk provisions
for 2013 were $188m, a decrease of $23m, or 11%,
compared with 2012. The decrease in loan impairment
charges and other credit risk provisions is primarily as a
result of a reduction in collectively assessed allowances
driven by declining loan balances of the run-off
consumer finance portfolio and lower provisions carried
relating to off-balance sheet exposures due to an overall
improved credit quality. The decrease in loan impairment
charges and other credit provisions was partially offset
by higher specific allowances for commercial customers
in the energy, real estate and agriculture sectors.