HSBC 2001 Annual Report Download - page 77
Download and view the complete annual report
Please find page 77 of the 2001 HSBC annual report below. You can navigate through the pages in the report by either clicking on the pages listed below, or by using the keyword search tool below to find specific information within the annual report.-
 1
1 -
2
-
3
-
4
-
5
-
6
-
7
-
8
-
9
-
10
-
11
-
12
-
13
-
14
-
15
-
16
-
17
-
18
-
19
-
20
-
21
-
22
-
23
-
24
-
25
-
26
-
27
-
28
-
29
-
30
-
31
-
32
-
33
-
34
-
35
-
36
-
37
-
38
-
39
-
40
-
41
-
42
-
43
-
44
-
45
-
46
-
47
-
48
-
49
-
50
-
51
-
52
-
53
-
54
-
55
-
56
-
57
-
58
-
59
-
60
-
61
-
62
-
63
-
64
-
65
-
66
-
 67
67 -
 68
68 -
 69
69 -
 70
70 -
 71
71 -
 72
72 -
 73
73 -
 74
74 -
 75
75 -
 76
76 -
 77
77 -
 78
78 -
 79
79 -
 80
80 -
 81
81 -
 82
82 -
 83
83 -
 84
84 -
 85
85 -
 86
86 -
 87
87 -
88
-
89
-
90
-
91
-
92
-
93
-
94
-
95
-
96
-
97
-
98
-
99
-
100
-
101
-
102
-
103
-
104
-
105
-
106
-
107
-
108
-
109
-
110
-
111
-
112
-
113
-
114
-
115
-
116
-
117
-
118
-
119
-
120
-
121
-
122
-
123
-
124
-
125
-
126
-
127
-
128
-
129
-
130
-
131
-
132
-
133
-
134
-
135
-
136
-
137
-
138
-
139
-
140
-
141
-
142
-
143
-
144
-
145
-
146
-
147
-
148
-
149
-
150
-
151
-
152
-
153
-
154
-
155
-
156
-
157
-
158
-
159
-
160
-
161
-
162
-
163
-
164
-
165
-
166
-
167
-
168
-
169
-
170
-
171
-
172
-
173
-
174
-
175
-
176
-
177
-
178
-
179
-
180
-
181
-
182
-
183
-
184
-
185
-
186
-
187
-
188
-
189
-
190
-
191
-
192
-
193
-
194
-
195
-
196
-
197
-
198
-
199
-
200
-
201
-
202
-
203
-
204
-
205
-
206
-
207
-
208
-
209
-
210
-
211
-
212
-
213
-
214
-
215
-
216
-
217
-
218
-
219
-
220
-
221
-
222
-
223
-
224
-
225
-
226
-
227
-
228
-
229
-
230
-
231
-
232
-
233
-
234
-
235
-
236
-
237
-
238
-
239
-
240
-
241
-
242
-
243
-
244
-
245
-
246
-
247
-
248
-
249
-
250
-
251
-
252
-
253
-
254
-
255
-
256
-
257
-
258
-
259
-
260
-
261
-
262
-
263
-
264
-
265
-
266
-
267
-
268
-
269
-
270
-
271
-
272
-
273
-
274
-
275
-
276
-
277
-
278
-
279
-
280
-
281
-
282
-
283
-
284
 |
 |
75
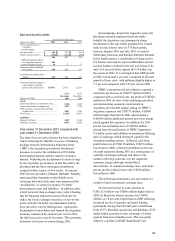
Year ended 31 December 2001 compared with
year ended 31 December 2000
All commentary is made on a cash basis, that is
excluding the impact of goodwill amortisation.
Personal Financial Services
Personal Financial Services contributed US$3,504
million to pre-tax profits in 2001 and represented
39.8 per cent of such profits. Growth in pre-tax
profits over 2000 amounted to US$467million, an
increase of 15 per cent. This was driven by good
growth in operating profits before provisions with
revenues rising 6 per cent against cost growth of 3
per cent. Reflecting significant growth in personal
lending, provisions for bad and doubtful debts rose
US$170 million an increase of 28 per cent. Disposal
gains were exceptionally high as a result of the
disposal of the Group’ s interest in British Interactive
Broadcasting.
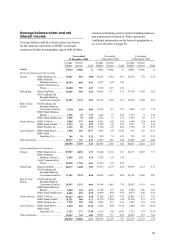
Net interest income increased by US$346
million or 5 per cent. Within this, net interest income
in Europe rose by US$217 million, mainly reflecting
the inclusion of a full year’ s income for CCF in
2001. Excluding the impact of CCF, net interest
income in Europe was effectively flat. In the UK, the
benefit of customer deposit growth was offset by the
impact on margins of competitive pricing initiatives
in mortgages and savings accounts.
In Hong Kong net interest income rose by
US$41 million as the benefits of increased credit
card lending and wider spreads on non-Hong Kong
dollar lending were largely offset by lower spreads
on Hong Kong Dollar savings and deposit accounts
and on residential mortgages.
Net interest income for the Rest of Asia-Pacific
rose by US$53 million with encouraging growth in
most entities in the region. In North America
increased net interest income of US$96m reflected
wider margins as funding costs fell more quickly
than lending, particularly mortgage lending, repriced.
The decline in funding costs was further helped by a
switch by depositors away from fixed rate CDs to
lower-paying savings and current accounts.
Net fees and commissions rose by US$209
million or 8 per cent on the year. US$128 million of
this rise was in Europe, again mainly reflecting the
inclusion of a full year of results for CCF. Fees in the
UK fell slightly as lower overdraft fees and the effect
of removing ATM fees on the LINK network and
mortgage valuation fees were only partially offset by
growth in wealth management income and fees on
investment products. Net fees in Hong Kong were up
by US$76 million, with outstanding success in fees
earned from sales of capital-guaranteed funds.
In North America fee income was effectively
unchanged; strongly rising wealth management
income and fees from high levels of mortgage
augmentation were offset by increased write-offs of
mortgage servicing rights as mortgage prepayments
rose in response to falling interest rates. The
mortgage business also suffered losses on
instruments held as hedges against the value of
mortgage servicing rights; such losses are reflected
in dealing profits. Overall the mortgage business
generated positive net interest and non-interest
income.
Other income rose by US$96 million, primarily
in Hong Kong due to strong growth in life insurance
income fees and the growth in embedded value in
this business.
Operating expenses increased by US$218
million or 3 per cent, mainly reflecting a US$139
million rise in staff costs and US$43 million of
increased premises and equipment expenses. In
Europe, expenses rose by US$229 million, mainly
due to the inclusion of a full year’ s costs for CCF.
Excluding this increase, costs in Europe were down.
In constant currency terms, the UK bank’s staff costs
rose 4 per cent due to annual pay rises and increased
headcount in wealth management and customer
telephone services.
Costs in Hong Kong increased by US$147
million, reflecting increased marketing and IT costs,
together with the impact of annual salary increments
and expansion of the cards business and Mandatory
Provident Fund services. In the rest of Asia-Pacific, a
US$96 million rise in costs included increased costs
following acquisitions and branch openings, higher
costs associated with the expansion of wealth
management services, costs of mortgage incentives
in Malaysia and branch expansion in a number of
countries.
Operating costs declined by US$72 million in
North America mainly due to the non-recurrence of
restructuring costs associated with the RNYC
acquisition in 2000, partly offset by increased wealth
management expenses together with lower
performance-based salaries in Canada. Costs in Latin