HSBC 2001 Annual Report Download - page 117
Download and view the complete annual report
Please find page 117 of the 2001 HSBC annual report below. You can navigate through the pages in the report by either clicking on the pages listed below, or by using the keyword search tool below to find specific information within the annual report.
115
HSBCs VAR should be viewed in the context of
the limitations of the methodology used. These
include:
• the model assumes that changes in risk factors
follow a normal distribution. This may not be
the case in reality and may lead to an
underestimation of the probability of extreme
market movements;
• the use of a 10-day holding period assumes that
all positions can be liquidated or hedged in 10
days. This may not fully reflect the market risk
arising from times of severe illiquidity, when a
10-day holding period may be insufficient to
fully liquidate or hedge all positions;
• the use of a 99 per cent confidence level does
not take account of any losses that might occur
beyond this level of confidence;
• the use of historical data as a proxy for
estimating future events may not encompass all
potential events, particularly those which are
extreme in nature;
• the assumption of independence between risk
types may not always hold and therefore result
in VAR not fully capturing market risk where
correlation between variables is exhibited;
• VAR is calculated at the close of business, with
intra-day exposures not being subject to intra-
day VAR calculations on an HSBC basis; and
• VAR does not necessarily capture all of the
higher order market risks and may underestimate
real market risk exposure.
HSBC recognises these limitations by
augmenting the VAR limits with other position and
sensitivity limit structures, as well as with stress
testing, both on individual portfolios and on a
consolidated basis. HSBCs stress testing regime
provides senior management with an assessment of
the impact of extreme events on the market risk
exposures of HSBC.
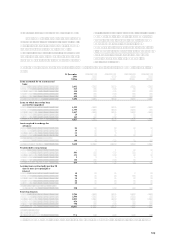
Trading VAR for HSBC for 2001 was:
Minimum Maximum Average
At 31 during the during the for the At 31
December year end year end year end December
2001 2001 2001 2001 2000
US$m US$m US$m US$m US$m
Total trading
activities ............... 122.0 60.8 173.4 102.2 75.0
Foreign exchange
trading positions ... 13.3 1.8 50.6 22.1 19.1
Interest rate trading
positions ............... 111.7 48.1 160.2 86.7 58.9
Equities trading
positions ............... 45.5 27.4 79.6 41.9 39.9
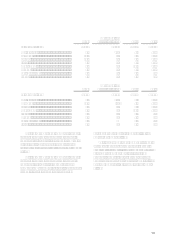
Trading VAR for HSBC for 2000 was:
Combined
HSBC Excluding former Republic operations
At 31 At 31 Minimum Maximum Average
December December during during For the
2000 2000 The year The year year
US$m US$m US$m US$m US$m
Total trading
activities............... 75.0 64.8 44.5 83.7 63.1
Foreign exchange
trading positions ... 19.1 17.2 8.9 26.8 16.6
Interest rate trading
positions............... 58.9 45.0 32.2 66.4 46.9
Equities trading
positions............... 39.9 39.9 23.6 53.4 36.2
Trading VAR for CCF is included in the above
table from the date of acquisition.
Trading VAR for the former Republic operations
at 31 December 2000 was US$23.2 million on a
variance/co-variance basis. On a historical
simulation approach, trading VAR for the former
Republic operations at 31 December 2000 was
US$11.7 million, the maximum during 2000 was
US$37.1 million, the minimum US$9.3 million and
the average US$18.8 million. The scope of
calculation of VAR on the former Republic
operations was refined at 30 June 2000, following a
review of its basis, to be more consistent with that of
the rest of HSBC. The maximum, minimum and
average on a historical simulation approach for each
half year are set out below:
Former Re
p
ublic o
p
erations
Total trading
First hal
f
2000
Second
hal
f
2000
US$m US$m
Maximum in the half-
y
ea
r
........... 37.1 19.1
Minimum in the half-
y
ea
r
............ 12.5 9.3
Avera
g
e for the half-
y
ea
r
............ 22.7 13.6
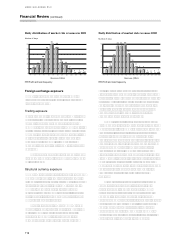
The average daily revenue earned from market
risk-related treasury activities in 2001, including
accrual book net interest income and funding related
to dealing positions, was US$13.9 million, compared
with US$10.0 million for 2000. The standard
deviation of these daily revenues was US$7.7 million
compared with US$4.4 million in 2000. An analysis
of the frequency distribution of daily revenues shows
that there were eleven days with negative revenues
during 2001. The most frequent result was a daily
revenue of between US$18 million and US$19
million with 20 occurrences. The highest daily
revenue was US$41 million.


