HSBC 2001 Annual Report Download - page 43
Download and view the complete annual report
Please find page 43 of the 2001 HSBC annual report below. You can navigate through the pages in the report by either clicking on the pages listed below, or by using the keyword search tool below to find specific information within the annual report.-
 1
1 -
2
-
3
-
4
-
5
-
6
-
7
-
8
-
9
-
10
-
11
-
12
-
13
-
14
-
15
-
16
-
17
-
18
-
19
-
20
-
21
-
22
-
23
-
24
-
25
-
26
-
27
-
28
-
29
-
30
-
31
-
32
-
 33
33 -
 34
34 -
 35
35 -
 36
36 -
 37
37 -
 38
38 -
 39
39 -
 40
40 -
 41
41 -
 42
42 -
 43
43 -
 44
44 -
 45
45 -
 46
46 -
 47
47 -
 48
48 -
 49
49 -
 50
50 -
 51
51 -
 52
52 -
 53
53 -
54
-
55
-
56
-
57
-
58
-
59
-
60
-
61
-
62
-
63
-
64
-
65
-
66
-
67
-
68
-
69
-
70
-
71
-
72
-
73
-
74
-
75
-
76
-
77
-
78
-
79
-
80
-
81
-
82
-
83
-
84
-
85
-
86
-
87
-
88
-
89
-
90
-
91
-
92
-
93
-
94
-
95
-
96
-
97
-
98
-
99
-
100
-
101
-
102
-
103
-
104
-
105
-
106
-
107
-
108
-
109
-
110
-
111
-
112
-
113
-
114
-
115
-
116
-
117
-
118
-
119
-
120
-
121
-
122
-
123
-
124
-
125
-
126
-
127
-
128
-
129
-
130
-
131
-
132
-
133
-
134
-
135
-
136
-
137
-
138
-
139
-
140
-
141
-
142
-
143
-
144
-
145
-
146
-
147
-
148
-
149
-
150
-
151
-
152
-
153
-
154
-
155
-
156
-
157
-
158
-
159
-
160
-
161
-
162
-
163
-
164
-
165
-
166
-
167
-
168
-
169
-
170
-
171
-
172
-
173
-
174
-
175
-
176
-
177
-
178
-
179
-
180
-
181
-
182
-
183
-
184
-
185
-
186
-
187
-
188
-
189
-
190
-
191
-
192
-
193
-
194
-
195
-
196
-
197
-
198
-
199
-
200
-
201
-
202
-
203
-
204
-
205
-
206
-
207
-
208
-
209
-
210
-
211
-
212
-
213
-
214
-
215
-
216
-
217
-
218
-
219
-
220
-
221
-
222
-
223
-
224
-
225
-
226
-
227
-
228
-
229
-
230
-
231
-
232
-
233
-
234
-
235
-
236
-
237
-
238
-
239
-
240
-
241
-
242
-
243
-
244
-
245
-
246
-
247
-
248
-
249
-
250
-
251
-
252
-
253
-
254
-
255
-
256
-
257
-
258
-
259
-
260
-
261
-
262
-
263
-
264
-
265
-
266
-
267
-
268
-
269
-
270
-
271
-
272
-
273
-
274
-
275
-
276
-
277
-
278
-
279
-
280
-
281
-
282
-
283
-
284
 |
 |

41
constant exchange rates, HSBC’s net fees and
commissions in 2000 would have been 27 per cent
higher than in 1999.
Dealing profits at US$1,626 million were
US$327 million higher than in 1999, over half of
which was attributable to the recent acquisitions.
Increased foreign exchange profits reflected higher
volumes in customer-driven business in both the
United Kingdom and Hong Kong. Dealing profits
also benefited from a recovery of 69 per cent of the
provisions made in 1999 against a Korean
corporate’s bonds upon liquidation of the position.
Other income was US$177 million higher at
US$1,716 million mainly due to the recent
acquisitions, together with the impact of the transfer
of Argentina’s pension and life businesses from
associated undertakings to subsidiaries in 1999.
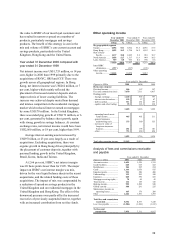
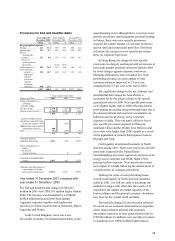
Operating expenses
Year ended 31
December 2001
Year ended 31
December 2000
Year ended 31
December 1999
US$m % US$
m
%US$
m
%
By geographical segment
Europe.................. 7,288 49.1 6,518 47.3 5,445 47.3
Hong Kong........... 2,140 14.4 1,986 14.4 1,896 16.5
Rest of Asia-
Pacific.............. 1,397 9.4 1,292 9.4 1,148 10.0
North America...... 2,488 16.7 2,363 17.1 1,582 13.7
Latin America....... 1,549 10.4 1,635 11.8 1,440 12.5
14,862 100.0 13,794 100.0 11,511 100.0
Goodwill amortisation
Europe.................. 632 348 9
Hong Kong........... –1
–
Rest of Asia-
Pacific.............. 8514
North America...... 142 143 3
Latin America....... 17 13 10
799 510 36
Intra-HSBC
eliminatio
n
....... (257
)
(217) (198)
Total operating
expenses .......... 15,404 14,087 11,349
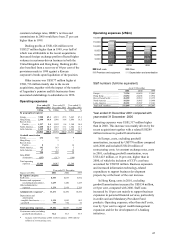
Year ended 31 December
Figures in US$m 2001 2000 1999
By expense category:
Staff costs............................. 8,553 8,057 6,692
Premises and equipment
(excluding depreciation) .. 1,639 1,480 1,329
Other administrative
expenses .......................... 3,279 2,959 2,329
Administrative expenses*... 13,471 12,496 10,350
Depreciation and
amortisation
–
tangible fixed assets........... 1,134 1,081 963
–
goodwill ............................ 799 510 36
Total operating expenses... 15,404 14,087 11,349
Cost:income ratio (excluding
goodwill amortisation)..... 56.4 55.3 53.9
*Includes US$156 million (2000: US$121 million; 1999 US$164
million) of restructuring costs.
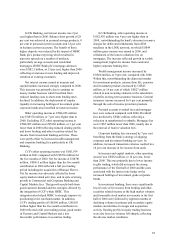
Operating expenses (US$m)
Staff costs Other
Premises and equipment Depreciation and amortisation
Staff numbers (full-time equivalent)
As at 31 December
2001 2000 1999
Europe................................... 73,326 69,629 53,861
Hong Kong............................ 24,654 24,204 23,932
Rest of Asia-Pacific .............. 26,259 22,919 21,375
North America ...................... 18,518 18,965 19,498
Latin America ....................... 28,292 25,907 27,181
Total staff numbers .............. 171,049 161,624 145,847
Year ended 31 December 2001 compared with
year ended 31 December 2000
Operating expenses were US$1,317 million higher
than in 2000. This increase was mainly driven by the
recent acquisitions together with a related US$289
million increase in goodwill amortisation.
In Europe, costs, excluding goodwill
amortisation, increased by US$770 million compared
with 2000 and included US$128 million of
restructuring costs. At constant exchange rates, costs
in 2001, excluding goodwill amortisation, were
US$1,023 million, or 16 per cent, higher than in
2000, of which the inclusion of CCF’ s cost base
accounted for US$769 million. Business expansion
and increased information technology-related
expenditure to support business development
projects lay at the heart of the cost increase.
In Hong Kong, costs in 2001, excluding
goodwill amortisation increased by US$154 million,
or 8 per cent, compared with 2000. Staff costs
increased by 10 per cent mainly to support business
expansion in personal financial services, particularly
in credit card and Mandatory Provident Fund
products. Operating expenses, other than staff costs,
rose by 5 per cent to support wealth management
expansion and for the development of e-banking
initiatives.
8,553
1,639
3,279
1,933
8,057
1,480
2,959
1,591
6,692
1,329
2,329
999
0
3,000
6,000
9,000
12,000
15,000
18,000
2001 2000 1999