HSBC 2001 Annual Report Download - page 50
Download and view the complete annual report
Please find page 50 of the 2001 HSBC annual report below. You can navigate through the pages in the report by either clicking on the pages listed below, or by using the keyword search tool below to find specific information within the annual report.-
 1
1 -
2
-
3
-
4
-
5
-
6
-
7
-
8
-
9
-
10
-
11
-
12
-
13
-
14
-
15
-
16
-
17
-
18
-
19
-
20
-
21
-
22
-
23
-
24
-
25
-
26
-
27
-
28
-
29
-
30
-
31
-
32
-
33
-
34
-
35
-
36
-
37
-
38
-
39
-
 40
40 -
 41
41 -
 42
42 -
 43
43 -
 44
44 -
 45
45 -
 46
46 -
 47
47 -
 48
48 -
 49
49 -
 50
50 -
 51
51 -
 52
52 -
 53
53 -
 54
54 -
 55
55 -
 56
56 -
 57
57 -
 58
58 -
 59
59 -
 60
60 -
61
-
62
-
63
-
64
-
65
-
66
-
67
-
68
-
69
-
70
-
71
-
72
-
73
-
74
-
75
-
76
-
77
-
78
-
79
-
80
-
81
-
82
-
83
-
84
-
85
-
86
-
87
-
88
-
89
-
90
-
91
-
92
-
93
-
94
-
95
-
96
-
97
-
98
-
99
-
100
-
101
-
102
-
103
-
104
-
105
-
106
-
107
-
108
-
109
-
110
-
111
-
112
-
113
-
114
-
115
-
116
-
117
-
118
-
119
-
120
-
121
-
122
-
123
-
124
-
125
-
126
-
127
-
128
-
129
-
130
-
131
-
132
-
133
-
134
-
135
-
136
-
137
-
138
-
139
-
140
-
141
-
142
-
143
-
144
-
145
-
146
-
147
-
148
-
149
-
150
-
151
-
152
-
153
-
154
-
155
-
156
-
157
-
158
-
159
-
160
-
161
-
162
-
163
-
164
-
165
-
166
-
167
-
168
-
169
-
170
-
171
-
172
-
173
-
174
-
175
-
176
-
177
-
178
-
179
-
180
-
181
-
182
-
183
-
184
-
185
-
186
-
187
-
188
-
189
-
190
-
191
-
192
-
193
-
194
-
195
-
196
-
197
-
198
-
199
-
200
-
201
-
202
-
203
-
204
-
205
-
206
-
207
-
208
-
209
-
210
-
211
-
212
-
213
-
214
-
215
-
216
-
217
-
218
-
219
-
220
-
221
-
222
-
223
-
224
-
225
-
226
-
227
-
228
-
229
-
230
-
231
-
232
-
233
-
234
-
235
-
236
-
237
-
238
-
239
-
240
-
241
-
242
-
243
-
244
-
245
-
246
-
247
-
248
-
249
-
250
-
251
-
252
-
253
-
254
-
255
-
256
-
257
-
258
-
259
-
260
-
261
-
262
-
263
-
264
-
265
-
266
-
267
-
268
-
269
-
270
-
271
-
272
-
273
-
274
-
275
-
276
-
277
-
278
-
279
-
280
-
281
-
282
-
283
-
284
 |
 |

HSBC HOLDINGS PLC
Financial Review (continued)
48
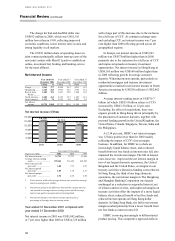
difference between that cost and post-tax profit
attributable to ordinary shareholders is the amount of
economic profit generated. Economic profit is used
by management as one of the measures to decide
where to allocate resources so that they will be most
productive. HSBC internally emphasises the trend in
economic profit within business units rather than
absolute amounts in order to concentrate focus on
external factors rather than measurement bases. As a
result of this, HSBC has consistently used a
benchmark cost of capital of 12.5 per cent on a
consolidated basis. Given recent changes in interest
rates and in the composition of HSBC, HSBC
believes that its true cost of capital on a consolidated
basis is now 10.5 per cent. HSBC plans to continue
to use the figure of 12.5 per cent to ensure
consistency and to help comparability.
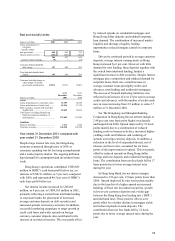
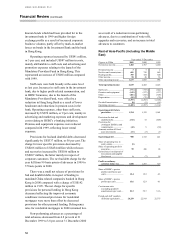
Economic profit fell by US$1,924 million, or
113 per cent, compared with 2000 reflecting the
settlement of the Princeton Note Matter, the
exceptional provisions in respect of Argentina and
higher invested equity following the acquisition of
CCF. Measurement of economic profit involves a
number of assumptions and, therefore, management
believe that the trend over time is more relevant than
the absolute economic profit reported for a single
period.
Economic profit
2001 2000
US$m % US$
m
%
Average invested
capital....................... 51,933 43,744
Return on invested
capital*..................... 6,274 12.1 7,174 16.4
After charging:
Princeton settlemen
t
...... (323) (0.6 )
–
–
Additional Argentine
general provisions
and losses ................. (1,120 ) (2.2) – –
Benchmark cost of
capital....................... (6,492 ) (12.5 ) (5,468) (12.5)
Economic profi
t
............ (218) (0.4 ) 1,706 3.9
* Return on invested capital is based on cash-based attributable
profit adjusted for depreciation attributable to revaluation
surpluses. Average invested capital is measured as shareholders’
funds after adding back goodwill amortised and goodwill
previously written-off directly to reserves and deducting property
revaluation reserves. This measure broadly reflects cash invested
capital.
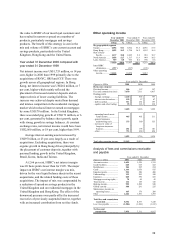
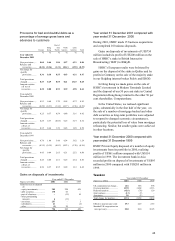
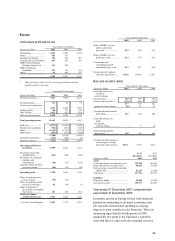
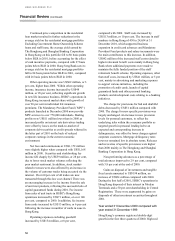
Analysis by geographical segment
Profit on ordinary activities before tax by
segment
Year ended 31 December
2001 2000 1999
US$m % US$
m
%US$
m
%
Europe .................. 3,542 44.3 3,658 37.4 3,322 41.6
Hong Kong........... 3,883 48.5 3,691 37.8 3,054 38.3
Rest of Asia-
Pacific.............. 1,088 13.6 1,265 12.9 329 4.1
North America...... 481 6.0 850 8.7 959 12.0
of which
Princeton ......... (575
)
(7.2
)
–
–
–
–
Latin America....... (994
)
(12.4
)
311 3.2 318 4.0
of which
Argentina
p
rovisions ........ (1,120
)
(14.0
)
–
–
–
–
Total 8,000 100.0 9,775 100.0 7,982 100.0
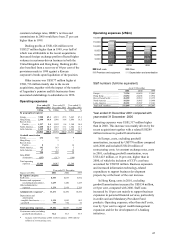
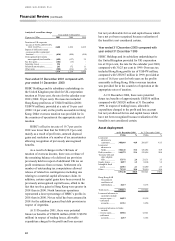
Total assets by segment
31 December
2001
31 December
2000
Total assets* US$m % US$
m
%
Europe .................................. 297,701 43.3 295,274 44.4
Hong Kong........................... 175,652 25.6 176,545 26.5
Rest of Asia-
Pacific............................... 62,151 9.0 56,676 8.5
North America...................... 136,526 19.9 118,053 17.7
Latin America....................... 15,210 2.2 19,073 2.9
Total 687,240 100.0 665,621 100.0
*Excluding Hong Kong SAR Government certificates of
indebtedness.
The results of operations by lines of business are
included in the following segmental disclosures in
the appropriate geographical segment. A separate
commentary is provided on the aggregate results of
each line of business on pages 72 to 78.
In the analysis of profit by geographical segment
which follows, the total of operating income and
operating expenses includes intra-HSBC items of
US$257 million in 2001, US$217 million in 2000
and US$198 million in 1999.