HSBC 2001 Annual Report Download - page 191
Download and view the complete annual report
Please find page 191 of the 2001 HSBC annual report below. You can navigate through the pages in the report by either clicking on the pages listed below, or by using the keyword search tool below to find specific information within the annual report.-
 1
1 -
2
-
3
-
4
-
5
-
6
-
7
-
8
-
9
-
10
-
11
-
12
-
13
-
14
-
15
-
16
-
17
-
18
-
19
-
20
-
21
-
22
-
23
-
24
-
25
-
26
-
27
-
28
-
29
-
30
-
31
-
32
-
33
-
34
-
35
-
36
-
37
-
38
-
39
-
40
-
41
-
42
-
43
-
44
-
45
-
46
-
47
-
48
-
49
-
50
-
51
-
52
-
53
-
54
-
55
-
56
-
57
-
58
-
59
-
60
-
61
-
62
-
63
-
64
-
65
-
66
-
67
-
68
-
69
-
70
-
71
-
72
-
73
-
74
-
75
-
76
-
77
-
78
-
79
-
80
-
81
-
82
-
83
-
84
-
85
-
86
-
87
-
88
-
89
-
90
-
91
-
92
-
93
-
94
-
95
-
96
-
97
-
98
-
99
-
100
-
101
-
102
-
103
-
104
-
105
-
106
-
107
-
108
-
109
-
110
-
111
-
112
-
113
-
114
-
115
-
116
-
117
-
118
-
119
-
120
-
121
-
122
-
123
-
124
-
125
-
126
-
127
-
128
-
129
-
130
-
131
-
132
-
133
-
134
-
135
-
136
-
137
-
138
-
139
-
140
-
141
-
142
-
143
-
144
-
145
-
146
-
147
-
148
-
149
-
150
-
151
-
152
-
153
-
154
-
155
-
156
-
157
-
158
-
159
-
160
-
161
-
162
-
163
-
164
-
165
-
166
-
167
-
168
-
169
-
170
-
171
-
172
-
173
-
174
-
175
-
176
-
177
-
178
-
179
-
180
-
 181
181 -
 182
182 -
 183
183 -
 184
184 -
 185
185 -
 186
186 -
 187
187 -
 188
188 -
 189
189 -
 190
190 -
 191
191 -
 192
192 -
 193
193 -
 194
194 -
 195
195 -
 196
196 -
 197
197 -
 198
198 -
 199
199 -
 200
200 -
 201
201 -
202
-
203
-
204
-
205
-
206
-
207
-
208
-
209
-
210
-
211
-
212
-
213
-
214
-
215
-
216
-
217
-
218
-
219
-
220
-
221
-
222
-
223
-
224
-
225
-
226
-
227
-
228
-
229
-
230
-
231
-
232
-
233
-
234
-
235
-
236
-
237
-
238
-
239
-
240
-
241
-
242
-
243
-
244
-
245
-
246
-
247
-
248
-
249
-
250
-
251
-
252
-
253
-
254
-
255
-
256
-
257
-
258
-
259
-
260
-
261
-
262
-
263
-
264
-
265
-
266
-
267
-
268
-
269
-
270
-
271
-
272
-
273
-
274
-
275
-
276
-
277
-
278
-
279
-
280
-
281
-
282
-
283
-
284
 |
 |

189
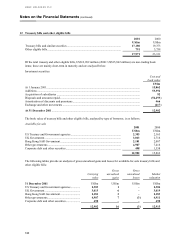
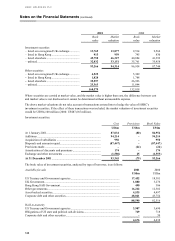
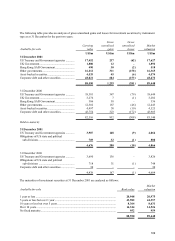
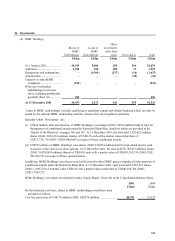
The following table provides an analysis of gross unrealised gains and losses for investment securities by instrument
type as at 31 December for the past two years:
Available-for-sale Carryin
g
value
Gross
unrealise
d
gains
Gross
unrealise
d
losses
M
arke
t
valuation
US$m US$m US$m US$m
31 December 2001
US Treasury and Government agencies ............ 17,452 237 (62) 17,627
UK Government................................................ 1,880 12
–
1,892
Hong Kong SAR Government .......................... 490 30 (2) 518
Other governments............................................ 16,212 311 (158) 16,365
Asset-backed securities..................................... 4,535 45 (6) 4,574
Corporate debt and other securities................... 48,021 604 (153) 48,472
88,590 1,239 (381) 89,448
31 December 2000
US Treasury and Government agencies ............ 18,381 347 (79) 18,649
UK Government................................................ 3,276 7 (1) 3,282
Hong Kong SAR Government .......................... 306 30
–
336
Other governments............................................ 12,302 187 (46) 12,443
Asset-backed securities..................................... 4,497 38 (10) 4,525
Corporate debt and other securities................... 43,754 323 (172) 43,905
82,516 932 (308) 83,140
Held-to-maturity
31 December 2001
US Treasury and Government agencies ............ 3,907 168 (9) 4,066
Obligations of US state and political
sub-divisions ................................................. 769 32 (1) 800
4,676 200 (10) 4,866
31 December 2000
US Treasury and Government agencies ............ 3,690 136
–
3,826
Obligations of US state and political
sub-divisions ................................................. 718 31 (1) 748
Corporate debt and other securities................... 30
–
–
30
4,438 167 (1) 4,604
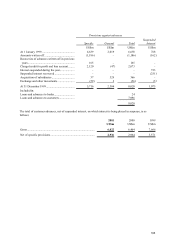
The maturities of investment securities at 31 December 2001 are analysed as follows:
Available-for-sale Book value
M
arke
t
valuation
1 year or less .............................................................................................................. 20,948 20,975
5 years or less but over 1 year.................................................................................... 43,982 44,357
10 years or less but over 5 years ................................................................................ 8,364 8,631
Over 10 years ............................................................................................................. 14,344 14,526
No fixed maturity....................................................................................................... 952 959
88,590 89,448