HSBC 2001 Annual Report Download - page 190
Download and view the complete annual report
Please find page 190 of the 2001 HSBC annual report below. You can navigate through the pages in the report by either clicking on the pages listed below, or by using the keyword search tool below to find specific information within the annual report.-
 1
1 -
2
-
3
-
4
-
5
-
6
-
7
-
8
-
9
-
10
-
11
-
12
-
13
-
14
-
15
-
16
-
17
-
18
-
19
-
20
-
21
-
22
-
23
-
24
-
25
-
26
-
27
-
28
-
29
-
30
-
31
-
32
-
33
-
34
-
35
-
36
-
37
-
38
-
39
-
40
-
41
-
42
-
43
-
44
-
45
-
46
-
47
-
48
-
49
-
50
-
51
-
52
-
53
-
54
-
55
-
56
-
57
-
58
-
59
-
60
-
61
-
62
-
63
-
64
-
65
-
66
-
67
-
68
-
69
-
70
-
71
-
72
-
73
-
74
-
75
-
76
-
77
-
78
-
79
-
80
-
81
-
82
-
83
-
84
-
85
-
86
-
87
-
88
-
89
-
90
-
91
-
92
-
93
-
94
-
95
-
96
-
97
-
98
-
99
-
100
-
101
-
102
-
103
-
104
-
105
-
106
-
107
-
108
-
109
-
110
-
111
-
112
-
113
-
114
-
115
-
116
-
117
-
118
-
119
-
120
-
121
-
122
-
123
-
124
-
125
-
126
-
127
-
128
-
129
-
130
-
131
-
132
-
133
-
134
-
135
-
136
-
137
-
138
-
139
-
140
-
141
-
142
-
143
-
144
-
145
-
146
-
147
-
148
-
149
-
150
-
151
-
152
-
153
-
154
-
155
-
156
-
157
-
158
-
159
-
160
-
161
-
162
-
163
-
164
-
165
-
166
-
167
-
168
-
169
-
170
-
171
-
172
-
173
-
174
-
175
-
176
-
177
-
178
-
179
-
 180
180 -
 181
181 -
 182
182 -
 183
183 -
 184
184 -
 185
185 -
 186
186 -
 187
187 -
 188
188 -
 189
189 -
 190
190 -
 191
191 -
 192
192 -
 193
193 -
 194
194 -
 195
195 -
 196
196 -
 197
197 -
 198
198 -
 199
199 -
 200
200 -
201
-
202
-
203
-
204
-
205
-
206
-
207
-
208
-
209
-
210
-
211
-
212
-
213
-
214
-
215
-
216
-
217
-
218
-
219
-
220
-
221
-
222
-
223
-
224
-
225
-
226
-
227
-
228
-
229
-
230
-
231
-
232
-
233
-
234
-
235
-
236
-
237
-
238
-
239
-
240
-
241
-
242
-
243
-
244
-
245
-
246
-
247
-
248
-
249
-
250
-
251
-
252
-
253
-
254
-
255
-
256
-
257
-
258
-
259
-
260
-
261
-
262
-
263
-
264
-
265
-
266
-
267
-
268
-
269
-
270
-
271
-
272
-
273
-
274
-
275
-
276
-
277
-
278
-
279
-
280
-
281
-
282
-
283
-
284
 |
 |

HSBC HOLDINGS PLC
Notes on the Financial Statements (continued)
188
2001 2000
B
oo
k
value
M
arke
t
valuation
B
oo
k
value
M
arke
t
valuation
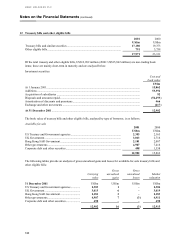
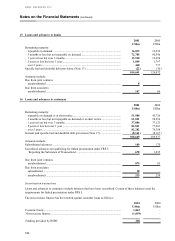
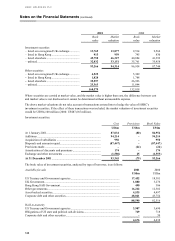
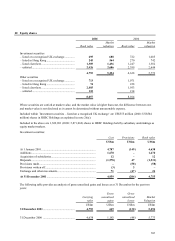
Investment securities
– listed on a recognised UK exchange.............. 13,769 13,877 9,514 9,564
– listed in Hong Kong ...................................... 915 959 795 830
– listed elsewhere ............................................. 45,750 46,327 40,884 41,392
– unlisted .......................................................... 32,832 33,151 35,761 35,958
93,266 94,314 86,954 87,744
Other securities
– listed on a recognised UK exchange.............. 6,525 5,309
–listed in Hong Kong ...................................... 1,828 1,788
–listed elsewhere ............................................. 35,597 26,923
– unlisted .......................................................... 23,363 11,844
160,579 132,818
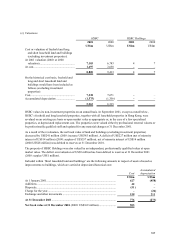
Where securities are carried at market value, and the market value is higher than cost, the difference between cost
and market value is not disclosed as it cannot be determined without unreasonable expense.
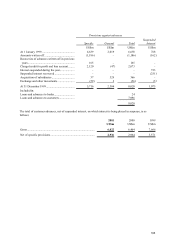
The above market valuations do not take account of transactions entered into to hedge the value of HSBC’ s
investment securities. If the effect of these transactions was included, the market valuation of investment securities
would be US$94,100 million (2000: US$87,665 million).
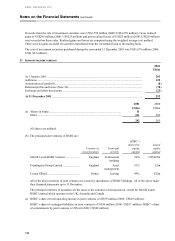
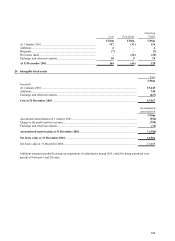
Investment securities:
Cos
t
Provisions Book Value
US$m US$m US$m
At 1 January 2001.......................................................................... 87,034 (80) 86,954
Additions ....................................................................................... 94,214
–
94,214
Acquisition of subsidiaries ............................................................ 950
–
950
Disposals and amounts repaid........................................................ (87,447)
–
(87,447)
Provisions made.............................................................................
–
(24) (24)
Amortisation of discounts and premiums ...................................... 174
–
174
Exchange and other movements .................................................... (1,580) 25 (1,555)
At 31 December 2001................................................................... 93,345 (79) 93,266
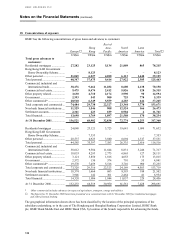
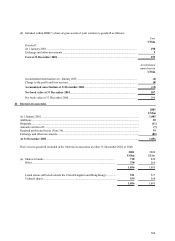
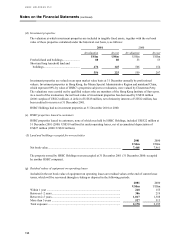
The book value of investment securities, analysed by type of borrower, is as follows:
Available-for-sale 2001 2000
US$m US$m
US Treasury and Government agencies ................................................................... 17,452 18,381
UK Government....................................................................................................... 1,880 3,276
Hong Kong SAR Government ................................................................................. 490 306
Other governments................................................................................................... 16,212 12,302
Asset-backed securities............................................................................................ 4,535 4,497
Corporate debt and other securities.......................................................................... 48,021 43,754
88,590 82,516
Held-to-maturity
US Treasury and Government agencies ................................................................... 3,907 3,690
Obligations of US state and political sub-divisions................................................. 769 718
Corporate debt and other securities..........................................................................
–
30
4,676 4,438