HSBC 2001 Annual Report Download - page 207
Download and view the complete annual report
Please find page 207 of the 2001 HSBC annual report below. You can navigate through the pages in the report by either clicking on the pages listed below, or by using the keyword search tool below to find specific information within the annual report.-
 1
1 -
2
-
3
-
4
-
5
-
6
-
7
-
8
-
9
-
10
-
11
-
12
-
13
-
14
-
15
-
16
-
17
-
18
-
19
-
20
-
21
-
22
-
23
-
24
-
25
-
26
-
27
-
28
-
29
-
30
-
31
-
32
-
33
-
34
-
35
-
36
-
37
-
38
-
39
-
40
-
41
-
42
-
43
-
44
-
45
-
46
-
47
-
48
-
49
-
50
-
51
-
52
-
53
-
54
-
55
-
56
-
57
-
58
-
59
-
60
-
61
-
62
-
63
-
64
-
65
-
66
-
67
-
68
-
69
-
70
-
71
-
72
-
73
-
74
-
75
-
76
-
77
-
78
-
79
-
80
-
81
-
82
-
83
-
84
-
85
-
86
-
87
-
88
-
89
-
90
-
91
-
92
-
93
-
94
-
95
-
96
-
97
-
98
-
99
-
100
-
101
-
102
-
103
-
104
-
105
-
106
-
107
-
108
-
109
-
110
-
111
-
112
-
113
-
114
-
115
-
116
-
117
-
118
-
119
-
120
-
121
-
122
-
123
-
124
-
125
-
126
-
127
-
128
-
129
-
130
-
131
-
132
-
133
-
134
-
135
-
136
-
137
-
138
-
139
-
140
-
141
-
142
-
143
-
144
-
145
-
146
-
147
-
148
-
149
-
150
-
151
-
152
-
153
-
154
-
155
-
156
-
157
-
158
-
159
-
160
-
161
-
162
-
163
-
164
-
165
-
166
-
167
-
168
-
169
-
170
-
171
-
172
-
173
-
174
-
175
-
176
-
177
-
178
-
179
-
180
-
181
-
182
-
183
-
184
-
185
-
186
-
187
-
188
-
189
-
190
-
191
-
192
-
193
-
194
-
195
-
196
-
 197
197 -
 198
198 -
 199
199 -
 200
200 -
 201
201 -
 202
202 -
 203
203 -
 204
204 -
 205
205 -
 206
206 -
 207
207 -
 208
208 -
 209
209 -
 210
210 -
 211
211 -
 212
212 -
 213
213 -
 214
214 -
 215
215 -
 216
216 -
 217
217 -
218
-
219
-
220
-
221
-
222
-
223
-
224
-
225
-
226
-
227
-
228
-
229
-
230
-
231
-
232
-
233
-
234
-
235
-
236
-
237
-
238
-
239
-
240
-
241
-
242
-
243
-
244
-
245
-
246
-
247
-
248
-
249
-
250
-
251
-
252
-
253
-
254
-
255
-
256
-
257
-
258
-
259
-
260
-
261
-
262
-
263
-
264
-
265
-
266
-
267
-
268
-
269
-
270
-
271
-
272
-
273
-
274
-
275
-
276
-
277
-
278
-
279
-
280
-
281
-
282
-
283
-
284
 |
 |

205
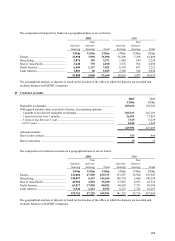
The composition of deposits by banks on a geographical basis is set out below:
2001 2000
Interest-
bearin
g
Non
interest-
bearin
g
Tota
l
Interest-
bearin
g
Non
interest-
bearin
g
Tota
l
US$m US$m US$m US$m US$m US$m
Europe................................................... 32,998 3,910 36,908 36,490 7,398 43,888
Hong Kong............................................ 2,876 395 3,271 1,880 340 2,220
Rest of Asia-Pacific .............................. 3,640 370 4,010 3,576 504 4,080
North America ...................................... 6,485 1,117 7,602 6,370 851 7,221
Latin America ....................................... 1,801 48 1,849 2,300 344 2,644
47,800 5,840 53,640 50,616 9,437 60,053
The geographical analysis of deposits is based on the location of the office in which the deposits are recorded and
excludes balances with HSBC companies.
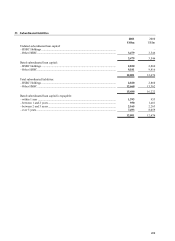
29 Customer accounts
2001 2000
US$m US$m
Repayable on demand.............................................................................................. 209,634 182,582
With agreed maturity dates or periods of notice, by remaining maturity:
– 3 months or less but not repayable on demand..................................................... 205,231 207,101
– 1 year or less but over 3 months........................................................................... 26,591 27,867
– 5 years or less but over 1 year .............................................................................. 7,519 8,229
– over 5 years .......................................................................................................... 1,016 1,290
449,991 427,069
Amounts include:
Due to joint ventures ............................................................................................... 333 869
Due to associates ..................................................................................................... 19 31
The composition of customer accounts on a geographical basis is set out below:
2001 2000
Interest-
bearin
g
Non
interest-
bearin
g
Tota
l
Interest-
bearin
g
Non
interest-
bearin
g
Tota
l
US$m US$m US$m US$m US$m US$m
Europe................................................... 141,802 27,569 169,371 133,557 25,948 159,505
Hong Kong............................................ 140,097 6,447 146,544 140,754 5,640 146,394
Rest of Asia-Pacific .............................. 40,904 4,594 45,498 37,883 4,633 42,516
North America ...................................... 63,017 17,005 80,022 60,638 7,751 68,389
Latin America ....................................... 6,942 1,614 8,556 8,523 1,742 10,265
392,762 57,229 449,991 381,355 45,714 427,069
The geographical analysis of deposits is based on the location of the office in which the deposits are recorded and
excludes balances with HSBC companies.