HSBC 2001 Annual Report Download - page 268
Download and view the complete annual report
Please find page 268 of the 2001 HSBC annual report below. You can navigate through the pages in the report by either clicking on the pages listed below, or by using the keyword search tool below to find specific information within the annual report.-
 1
1 -
2
-
3
-
4
-
5
-
6
-
7
-
8
-
9
-
10
-
11
-
12
-
13
-
14
-
15
-
16
-
17
-
18
-
19
-
20
-
21
-
22
-
23
-
24
-
25
-
26
-
27
-
28
-
29
-
30
-
31
-
32
-
33
-
34
-
35
-
36
-
37
-
38
-
39
-
40
-
41
-
42
-
43
-
44
-
45
-
46
-
47
-
48
-
49
-
50
-
51
-
52
-
53
-
54
-
55
-
56
-
57
-
58
-
59
-
60
-
61
-
62
-
63
-
64
-
65
-
66
-
67
-
68
-
69
-
70
-
71
-
72
-
73
-
74
-
75
-
76
-
77
-
78
-
79
-
80
-
81
-
82
-
83
-
84
-
85
-
86
-
87
-
88
-
89
-
90
-
91
-
92
-
93
-
94
-
95
-
96
-
97
-
98
-
99
-
100
-
101
-
102
-
103
-
104
-
105
-
106
-
107
-
108
-
109
-
110
-
111
-
112
-
113
-
114
-
115
-
116
-
117
-
118
-
119
-
120
-
121
-
122
-
123
-
124
-
125
-
126
-
127
-
128
-
129
-
130
-
131
-
132
-
133
-
134
-
135
-
136
-
137
-
138
-
139
-
140
-
141
-
142
-
143
-
144
-
145
-
146
-
147
-
148
-
149
-
150
-
151
-
152
-
153
-
154
-
155
-
156
-
157
-
158
-
159
-
160
-
161
-
162
-
163
-
164
-
165
-
166
-
167
-
168
-
169
-
170
-
171
-
172
-
173
-
174
-
175
-
176
-
177
-
178
-
179
-
180
-
181
-
182
-
183
-
184
-
185
-
186
-
187
-
188
-
189
-
190
-
191
-
192
-
193
-
194
-
195
-
196
-
197
-
198
-
199
-
200
-
201
-
202
-
203
-
204
-
205
-
206
-
207
-
208
-
209
-
210
-
211
-
212
-
213
-
214
-
215
-
216
-
217
-
218
-
219
-
220
-
221
-
222
-
223
-
224
-
225
-
226
-
227
-
228
-
229
-
230
-
231
-
232
-
233
-
234
-
235
-
236
-
237
-
238
-
239
-
240
-
241
-
242
-
243
-
244
-
245
-
246
-
247
-
248
-
249
-
250
-
251
-
252
-
253
-
254
-
255
-
256
-
257
-
 258
258 -
 259
259 -
 260
260 -
 261
261 -
 262
262 -
 263
263 -
 264
264 -
 265
265 -
 266
266 -
 267
267 -
 268
268 -
 269
269 -
 270
270 -
 271
271 -
 272
272 -
 273
273 -
 274
274 -
 275
275 -
 276
276 -
 277
277 -
 278
278 -
279
-
280
-
281
-
282
-
283
-
284
 |
 |

HSBC HOLDINGS PLC
Notes on the Financial Statements (continued)
266
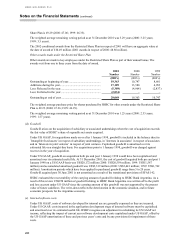
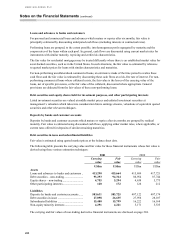
Loans and advances to banks and customers
For personal and commercial loans and advances which mature or reprice after six months, fair value is
principally estimated by discounting anticipated cash flows (including interests at contractual rates).
Performing loans are grouped, to the extent possible, into homogenous pools segregated by maturity and the
coupon rates of the loans within each pool. In general, cash flows are discounted using current market rates for
instruments with similar maturity, repricing and credit risk characteristics.
The fair value for residential mortgages may be treated differently where there is an established market value for
asset-backed securities, such as in the United States. In such situations, the fair value is estimated by reference
to quoted market prices for loans with similar characteristics and maturities.
For non-performing uncollateralised commercial loans, an estimate is made of the time period to realise these
cash flows and the fair value is estimated by discounting these cash flows at a risk-free rate of interest. For non-
performing commercial loans where collateral exists, the fair value is the lesser of the carrying value of the
loans, net of specific provisions, or the fair value of the collateral, discounted where appropriate. General
provisions are deducted from the fair values of these non-performing loans.
Debt securities and equity shares held for investment purposes, and other participating interests
Listed investment securities are valued at middle market prices and unlisted investment securities at
management’ s valuation which takes into consideration future earnings streams, valuations of equivalent quoted
securities and other relevant techniques.
Deposits by banks and customer accounts
Deposits by banks and customer accounts which mature or reprice after six months are grouped by residual
maturity. Fair value is estimated using discounted cash flows, applying either market rates, where applicable, or
current rates offered for deposits of similar remaining maturities.
Debt securities in issue and subordinated liabilities
Fair value is estimated using quoted market prices at the balance sheet date.
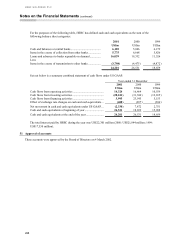
The following table presents the carrying value and fair value for those financial instruments whose fair value is
derived using these various estimation techniques:
2001 2000
Carrying
value Fair
value Carryin
g
value Fair
value
US$m US$m US$m US$m
Assets
Loans and advances to banks and customers .. 413,290 415,664 415,869 417,721
Debt securities – non-trading.......................... 93,293 94,314 86,954 87,744
Equity shares – non-trading ............................ 4,755 5,294 4,638 5,773
Other participating interests............................ 120 172 126 212
Liabilities
Deposits by banks and customer accounts...... 503,631 503,725 487,122 487,174
Debt securities in issue ................................... 27,098 26,635 27,956 28,107
Subordinated liabilities ................................... 15,480 15,799 16,222 16,168
Non-equity minority interests ......................... 4,291 4,221 5,171 5,535
The carrying and fair values of non-trading derivative financial instruments are disclosed on page 224.