HSBC 2001 Annual Report Download - page 243
Download and view the complete annual report
Please find page 243 of the 2001 HSBC annual report below. You can navigate through the pages in the report by either clicking on the pages listed below, or by using the keyword search tool below to find specific information within the annual report.-
 1
1 -
2
-
3
-
4
-
5
-
6
-
7
-
8
-
9
-
10
-
11
-
12
-
13
-
14
-
15
-
16
-
17
-
18
-
19
-
20
-
21
-
22
-
23
-
24
-
25
-
26
-
27
-
28
-
29
-
30
-
31
-
32
-
33
-
34
-
35
-
36
-
37
-
38
-
39
-
40
-
41
-
42
-
43
-
44
-
45
-
46
-
47
-
48
-
49
-
50
-
51
-
52
-
53
-
54
-
55
-
56
-
57
-
58
-
59
-
60
-
61
-
62
-
63
-
64
-
65
-
66
-
67
-
68
-
69
-
70
-
71
-
72
-
73
-
74
-
75
-
76
-
77
-
78
-
79
-
80
-
81
-
82
-
83
-
84
-
85
-
86
-
87
-
88
-
89
-
90
-
91
-
92
-
93
-
94
-
95
-
96
-
97
-
98
-
99
-
100
-
101
-
102
-
103
-
104
-
105
-
106
-
107
-
108
-
109
-
110
-
111
-
112
-
113
-
114
-
115
-
116
-
117
-
118
-
119
-
120
-
121
-
122
-
123
-
124
-
125
-
126
-
127
-
128
-
129
-
130
-
131
-
132
-
133
-
134
-
135
-
136
-
137
-
138
-
139
-
140
-
141
-
142
-
143
-
144
-
145
-
146
-
147
-
148
-
149
-
150
-
151
-
152
-
153
-
154
-
155
-
156
-
157
-
158
-
159
-
160
-
161
-
162
-
163
-
164
-
165
-
166
-
167
-
168
-
169
-
170
-
171
-
172
-
173
-
174
-
175
-
176
-
177
-
178
-
179
-
180
-
181
-
182
-
183
-
184
-
185
-
186
-
187
-
188
-
189
-
190
-
191
-
192
-
193
-
194
-
195
-
196
-
197
-
198
-
199
-
200
-
201
-
202
-
203
-
204
-
205
-
206
-
207
-
208
-
209
-
210
-
211
-
212
-
213
-
214
-
215
-
216
-
217
-
218
-
219
-
220
-
221
-
222
-
223
-
224
-
225
-
226
-
227
-
228
-
229
-
230
-
231
-
232
-
 233
233 -
 234
234 -
 235
235 -
 236
236 -
 237
237 -
 238
238 -
 239
239 -
 240
240 -
 241
241 -
 242
242 -
 243
243 -
 244
244 -
 245
245 -
 246
246 -
 247
247 -
 248
248 -
 249
249 -
 250
250 -
 251
251 -
 252
252 -
 253
253 -
254
-
255
-
256
-
257
-
258
-
259
-
260
-
261
-
262
-
263
-
264
-
265
-
266
-
267
-
268
-
269
-
270
-
271
-
272
-
273
-
274
-
275
-
276
-
277
-
278
-
279
-
280
-
281
-
282
-
283
-
284
 |
 |

241
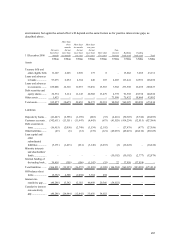
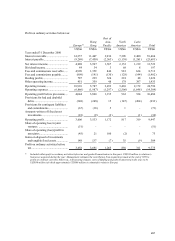
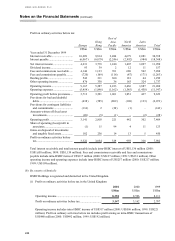
Profit on ordinary activities before tax:
Europe*
H
on
g
K
on
g
R
est o
f
Asia-
Pacific North
America Latin
America Tota
l
US$m US$m US$m US$m US$m US$m
Year ended 31 December 2000
Interest receivable............................. 14,257 11,447 3,930 7,290 2,480 39,404
Interest payable................................. (9,269) (7,450) (2,563) (5,138) (1,261) (25,681)
Net interest income ........................... 4,988 3,997 1,367 2,152 1,219 13,723
Dividend income............................... 84 34 3 68 8 197
Fees and commissions receivable ..... 4,909 1,359 840 981 624 8,713
Fees and commissions payable ......... (809) (191) (130) (128) (144) (1,402)
Dealing profits .................................. 787 229 324 218 68 1,626
Other operating income..................... 951 359 48 178 397 1,933
Operating income.............................. 10,910 5,787 2,452 3,469 2,172 24,790
Operating expenses ........................... (6,866) (1,987) (1,297) (2,506) (1,648) (14,304)
Operating profit before provisions.... 4,044 3,800 1,155 963 524 10,486
Provisions for bad and doubtful
debts .............................................. (348) (248) 15 (147) (204) (932)
Provisions for contingent liabilities
and commitments .......................... (67) (10) 5 1
–
(71)
Amounts written off fixed asset
investments.................................... (23) (9) (3 ) – (1) (36)
Operating profit ................................ 3,606 3,533 1,172 817 319 9,447
Share of operating loss in joint
ventures ........................................ (51)
–
––
–
(51)
Share of operating (loss)/profit in
associates....................................... (45) 21 100 (2) 1 75
Gains on disposal of investments
and tangible fixed assets................ 148 137 (7) 35 (9) 304
Profit on ordinary activities before
tax.................................................. 3,658 3,691 1,265 850 311 9,775
* Included within profit on ordinary activities before tax and goodwill amortisation in Europe is US$169 million in relation to
businesses acquired during the year. Management estimates the contribution from acquisitions made at the end of 1999 to
profits on ordinary activities before tax, restructuring charges, costs of funding and goodwill amortised in the year, to be
US$850 million (of which approximately US$500 million is estimated to relate to Europe).