HSBC 2001 Annual Report Download - page 119
Download and view the complete annual report
Please find page 119 of the 2001 HSBC annual report below. You can navigate through the pages in the report by either clicking on the pages listed below, or by using the keyword search tool below to find specific information within the annual report.-
 1
1 -
2
-
3
-
4
-
5
-
6
-
7
-
8
-
9
-
10
-
11
-
12
-
13
-
14
-
15
-
16
-
17
-
18
-
19
-
20
-
21
-
22
-
23
-
24
-
25
-
26
-
27
-
28
-
29
-
30
-
31
-
32
-
33
-
34
-
35
-
36
-
37
-
38
-
39
-
40
-
41
-
42
-
43
-
44
-
45
-
46
-
47
-
48
-
49
-
50
-
51
-
52
-
53
-
54
-
55
-
56
-
57
-
58
-
59
-
60
-
61
-
62
-
63
-
64
-
65
-
66
-
67
-
68
-
69
-
70
-
71
-
72
-
73
-
74
-
75
-
76
-
77
-
78
-
79
-
80
-
81
-
82
-
83
-
84
-
85
-
86
-
87
-
88
-
89
-
90
-
91
-
92
-
93
-
94
-
95
-
96
-
97
-
98
-
99
-
100
-
101
-
102
-
103
-
104
-
105
-
106
-
107
-
108
-
 109
109 -
 110
110 -
 111
111 -
 112
112 -
 113
113 -
 114
114 -
 115
115 -
 116
116 -
 117
117 -
 118
118 -
 119
119 -
 120
120 -
 121
121 -
 122
122 -
 123
123 -
 124
124 -
 125
125 -
 126
126 -
 127
127 -
 128
128 -
 129
129 -
130
-
131
-
132
-
133
-
134
-
135
-
136
-
137
-
138
-
139
-
140
-
141
-
142
-
143
-
144
-
145
-
146
-
147
-
148
-
149
-
150
-
151
-
152
-
153
-
154
-
155
-
156
-
157
-
158
-
159
-
160
-
161
-
162
-
163
-
164
-
165
-
166
-
167
-
168
-
169
-
170
-
171
-
172
-
173
-
174
-
175
-
176
-
177
-
178
-
179
-
180
-
181
-
182
-
183
-
184
-
185
-
186
-
187
-
188
-
189
-
190
-
191
-
192
-
193
-
194
-
195
-
196
-
197
-
198
-
199
-
200
-
201
-
202
-
203
-
204
-
205
-
206
-
207
-
208
-
209
-
210
-
211
-
212
-
213
-
214
-
215
-
216
-
217
-
218
-
219
-
220
-
221
-
222
-
223
-
224
-
225
-
226
-
227
-
228
-
229
-
230
-
231
-
232
-
233
-
234
-
235
-
236
-
237
-
238
-
239
-
240
-
241
-
242
-
243
-
244
-
245
-
246
-
247
-
248
-
249
-
250
-
251
-
252
-
253
-
254
-
255
-
256
-
257
-
258
-
259
-
260
-
261
-
262
-
263
-
264
-
265
-
266
-
267
-
268
-
269
-
270
-
271
-
272
-
273
-
274
-
275
-
276
-
277
-
278
-
279
-
280
-
281
-
282
-
283
-
284
 |
 |

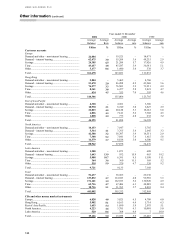
117
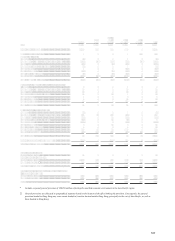
pesification of formerly US dollar denominated
assets and liabilities at differing exchange rates
destroyed capital within the banking system and in
the case of HSBC Argentina created a structured loss
of US$520 million. Discussions are taking place with
the Government of Argentina regarding
compensation for this loss but it is currently unclear
how, to what extent and in what timescale such
compensation might be delivered.
Details of HSBCs structural foreign currency
exposures are given in Note 40 in the Notes on the
Financial Statements.
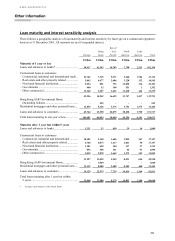
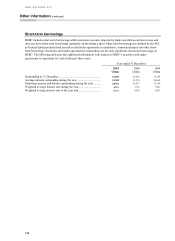
Interest rate exposure
HSBCs interest rate exposures comprise those
originating in its treasury trading activities and
structural interest rate exposures; both are managed
under limits described on page 114. Interest rate risk
arises on both trading positions and accrual books.
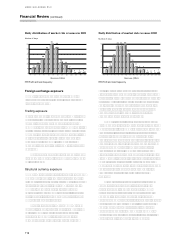
The average daily revenues earned from
treasury-related interest rate activities for 2001 were
US$10.3 million compared with US$6.5 million for
2000. The interest rate risk on interest rate trading
positions is set out in the trading VAR table on page
115.
Structural interest rate risk
Structural interest rate risk arises from the differing
repricing characteristics of commercial banking
assets and liabilities, including non-interest bearing
liabilities such as shareholders funds and some
current accounts. Each operating entity assesses the
structural interest rate risks which arise in its
business and either transfers such risks to its local
treasury unit for management or transfers the risks to
separate books managed by the local asset and
liability management committee (ALCO). Local
ALCOs regularly monitor all such interest rate risk
positions, subject to interest rate risk limits agreed
with HSBC Holdings. In the course of managing
interest rate risk, quantitative techniques and
simulation models are used where appropriate to
identify and assess the potential net interest income
and market value effects of these interest rate
positions in different interest rate scenarios. The
primary objective of such interest rate risk
management is to limit potential adverse effects of
interest rate movements on net interest income.
Assuming no management action in response to
interest rate movements, an immediate hypothetical
100 basis points parallel fall in all yield curves
worldwide on 1 January 2002 would decrease
planned net interest income for the 12 months to 31
December 2002 by US$196 million while a
hypothetical 100 basis points parallel rise in all yield
curves would decrease planned net interest income
by US$200 million.
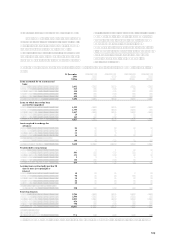
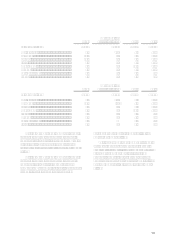
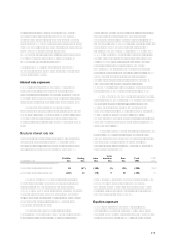
Rather than assuming that all interest rates move
together, HSBCs interest rate exposures can be
grouped into currency blocs whose interest rates are
considered more likely to move together. The
sensitivity of net interest income for 2002 can then
be described as follows:
Figures in US$ m
US dollar
bloc
Sterling
bloc
Asian
bloc
Latin
American
bloc
Euro
bloc
Total
2002
Total
2001
Change in 2002 projected net interest income
+100 basis points shift in yield curves 18
(
47)
(
140)
(
1)
(
30)
(
200)(139)
−100 basis points shift in yield curves
(
165)12
(
78)530
(
196)92
The change in HSBCs sensitivity to a fall of
100 basis points is mainly because further interest
rate cuts in the US dollar and Asian blocs at 31
December 2001 would not offer scope to reduce rates
on current and savings accounts by as much as the
full 100 basis points in view of the already low rates
payable on these liabilities, so compressing the
margins on these products.
The projections assume that rates of all
maturities move by the same amount and, therefore,
do not reflect the potential impact on net interest
income of some rates changing while others remain
unchanged. The projections also make other
simplifying assumptions, including an assumption
that all positions run to maturity. In practice, these
exposures are actively managed.
Equities exposure
HSBCs equities exposure comprises trading
equities, forming the basis of VAR, and long-term
equity investments. The latter are reviewed annually
by the Group Executive Committee and regularly