HSBC 2001 Annual Report Download - page 112
Download and view the complete annual report
Please find page 112 of the 2001 HSBC annual report below. You can navigate through the pages in the report by either clicking on the pages listed below, or by using the keyword search tool below to find specific information within the annual report.-
 1
1 -
2
-
3
-
4
-
5
-
6
-
7
-
8
-
9
-
10
-
11
-
12
-
13
-
14
-
15
-
16
-
17
-
18
-
19
-
20
-
21
-
22
-
23
-
24
-
25
-
26
-
27
-
28
-
29
-
30
-
31
-
32
-
33
-
34
-
35
-
36
-
37
-
38
-
39
-
40
-
41
-
42
-
43
-
44
-
45
-
46
-
47
-
48
-
49
-
50
-
51
-
52
-
53
-
54
-
55
-
56
-
57
-
58
-
59
-
60
-
61
-
62
-
63
-
64
-
65
-
66
-
67
-
68
-
69
-
70
-
71
-
72
-
73
-
74
-
75
-
76
-
77
-
78
-
79
-
80
-
81
-
82
-
83
-
84
-
85
-
86
-
87
-
88
-
89
-
90
-
91
-
92
-
93
-
94
-
95
-
96
-
97
-
98
-
99
-
100
-
101
-
 102
102 -
 103
103 -
 104
104 -
 105
105 -
 106
106 -
 107
107 -
 108
108 -
 109
109 -
 110
110 -
 111
111 -
 112
112 -
 113
113 -
 114
114 -
 115
115 -
 116
116 -
 117
117 -
 118
118 -
 119
119 -
 120
120 -
 121
121 -
 122
122 -
123
-
124
-
125
-
126
-
127
-
128
-
129
-
130
-
131
-
132
-
133
-
134
-
135
-
136
-
137
-
138
-
139
-
140
-
141
-
142
-
143
-
144
-
145
-
146
-
147
-
148
-
149
-
150
-
151
-
152
-
153
-
154
-
155
-
156
-
157
-
158
-
159
-
160
-
161
-
162
-
163
-
164
-
165
-
166
-
167
-
168
-
169
-
170
-
171
-
172
-
173
-
174
-
175
-
176
-
177
-
178
-
179
-
180
-
181
-
182
-
183
-
184
-
185
-
186
-
187
-
188
-
189
-
190
-
191
-
192
-
193
-
194
-
195
-
196
-
197
-
198
-
199
-
200
-
201
-
202
-
203
-
204
-
205
-
206
-
207
-
208
-
209
-
210
-
211
-
212
-
213
-
214
-
215
-
216
-
217
-
218
-
219
-
220
-
221
-
222
-
223
-
224
-
225
-
226
-
227
-
228
-
229
-
230
-
231
-
232
-
233
-
234
-
235
-
236
-
237
-
238
-
239
-
240
-
241
-
242
-
243
-
244
-
245
-
246
-
247
-
248
-
249
-
250
-
251
-
252
-
253
-
254
-
255
-
256
-
257
-
258
-
259
-
260
-
261
-
262
-
263
-
264
-
265
-
266
-
267
-
268
-
269
-
270
-
271
-
272
-
273
-
274
-
275
-
276
-
277
-
278
-
279
-
280
-
281
-
282
-
283
-
284
 |
 |

HSBC HOLDINGS PLC
Financial Review (continued)
110
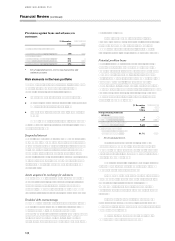
Interest forgone on non-performing lendings
Interest income that would have been recognised
under the original terms of the non-accrual,
suspended interest and restructured loans, amounted
to approximately US$640 million in 2001 compared
with US$955 million in 2000, US$946 million in
1999, US$811 million in 1998 and US$411 million
in 1997. Interest income of approximately US$261
million from such loans was recorded in 2001,
compared with US$324 million in 2000, US$328
million in 1999, US$192 million in 1998 and
US$232 million in 1997.
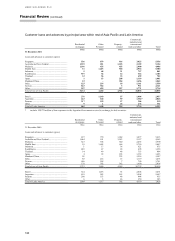
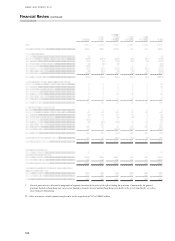
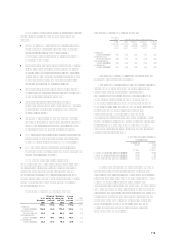
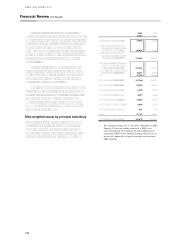
Non-performing customer loans* and related
specific provisions outstanding by geographical
segment
Non-
performing
loans
Specific
provisions
Non-
p
erforming
loans
Specific
p
rovisions
2001 2001 2000 2000
US$m US$m US$
m
US$
m
Europe.................. 3,682 2,204 3,376 2,135
Hong Kong........... 2,028 856 2,521 1,241
Rest of Asia-
Pacific ............. 2,723 1,786 3,081 1,929
North America ..... 625 275 642 262
Latin America ...... 591 379 752 498
9,649 5,500 10,372 6,065
* Net of suspended interest.
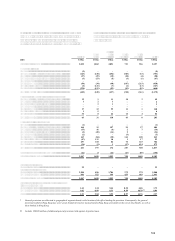
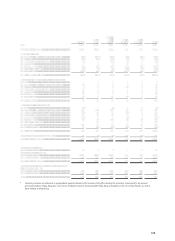
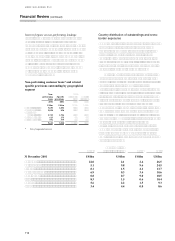
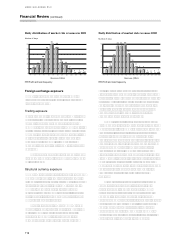
Country distribution of outstandings and cross-
border exposures
HSBC controls the risks associated with cross-border
lending, essentially the risk of foreign currency
required for payments not being available to local
residents, through a central process of internal
country limits which are determined by taking into
account both economic and political risks. Exposure
to individual countries and cross-border exposure in
aggregate is kept under continuous review.
The following tables analyse in-country foreign
currency and cross-border outstandings by type of
borrower to countries which individually represent in
excess of 1 per cent of HSBCs total assets.
Classification is based upon the country of residence
of the borrower but recognises the transfer of country
risk in respect of third party guarantees or residence
of the head office where the borrower is a branch. In
accordance with the Bank of England Country
Exposure Report (Form C1) guidelines, outstandings
comprise loans and advances (excluding settlement
accounts), amounts receivable under finance leases,
acceptances, commercial bills, certificates of deposit
and debt and equity securities (net of short
positions), and exclude accrued interest and intra-
HSBC exposures. Outstandings to counterparties in
the United Kingdom, HSBC Holdings country of
domicile, are not recorded on Form C1 and have not
been disclosed below.
Banks
Government and
official institutions Other Total
31 December 2001 US$bn US$bn US$bn US$bn
Germany ...................................................... 22.0 2.1 2.4 26.5
United States................................................ 5.1 9.8 9.6 24.5
France .......................................................... 8.1 1.5 4.1 13.7
The Netherlands........................................... 6.9 0.3 3.4 10.6
Hong Kong .................................................. 0.8 0.7 9.0 10.5
Italy.............................................................. 8.3 1.5 0.6 10.4
Canada ......................................................... 5.6 2.2 1.5 9.3
Japan............................................................ 3.4 4.4 0.8 8.6