HSBC 2001 Annual Report Download - page 49
Download and view the complete annual report
Please find page 49 of the 2001 HSBC annual report below. You can navigate through the pages in the report by either clicking on the pages listed below, or by using the keyword search tool below to find specific information within the annual report.-
 1
1 -
2
-
3
-
4
-
5
-
6
-
7
-
8
-
9
-
10
-
11
-
12
-
13
-
14
-
15
-
16
-
17
-
18
-
19
-
20
-
21
-
22
-
23
-
24
-
25
-
26
-
27
-
28
-
29
-
30
-
31
-
32
-
33
-
34
-
35
-
36
-
37
-
38
-
 39
39 -
 40
40 -
 41
41 -
 42
42 -
 43
43 -
 44
44 -
 45
45 -
 46
46 -
 47
47 -
 48
48 -
 49
49 -
 50
50 -
 51
51 -
 52
52 -
 53
53 -
 54
54 -
 55
55 -
 56
56 -
 57
57 -
 58
58 -
 59
59 -
60
-
61
-
62
-
63
-
64
-
65
-
66
-
67
-
68
-
69
-
70
-
71
-
72
-
73
-
74
-
75
-
76
-
77
-
78
-
79
-
80
-
81
-
82
-
83
-
84
-
85
-
86
-
87
-
88
-
89
-
90
-
91
-
92
-
93
-
94
-
95
-
96
-
97
-
98
-
99
-
100
-
101
-
102
-
103
-
104
-
105
-
106
-
107
-
108
-
109
-
110
-
111
-
112
-
113
-
114
-
115
-
116
-
117
-
118
-
119
-
120
-
121
-
122
-
123
-
124
-
125
-
126
-
127
-
128
-
129
-
130
-
131
-
132
-
133
-
134
-
135
-
136
-
137
-
138
-
139
-
140
-
141
-
142
-
143
-
144
-
145
-
146
-
147
-
148
-
149
-
150
-
151
-
152
-
153
-
154
-
155
-
156
-
157
-
158
-
159
-
160
-
161
-
162
-
163
-
164
-
165
-
166
-
167
-
168
-
169
-
170
-
171
-
172
-
173
-
174
-
175
-
176
-
177
-
178
-
179
-
180
-
181
-
182
-
183
-
184
-
185
-
186
-
187
-
188
-
189
-
190
-
191
-
192
-
193
-
194
-
195
-
196
-
197
-
198
-
199
-
200
-
201
-
202
-
203
-
204
-
205
-
206
-
207
-
208
-
209
-
210
-
211
-
212
-
213
-
214
-
215
-
216
-
217
-
218
-
219
-
220
-
221
-
222
-
223
-
224
-
225
-
226
-
227
-
228
-
229
-
230
-
231
-
232
-
233
-
234
-
235
-
236
-
237
-
238
-
239
-
240
-
241
-
242
-
243
-
244
-
245
-
246
-
247
-
248
-
249
-
250
-
251
-
252
-
253
-
254
-
255
-
256
-
257
-
258
-
259
-
260
-
261
-
262
-
263
-
264
-
265
-
266
-
267
-
268
-
269
-
270
-
271
-
272
-
273
-
274
-
275
-
276
-
277
-
278
-
279
-
280
-
281
-
282
-
283
-
284
 |
 |

47
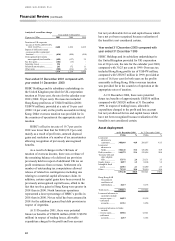
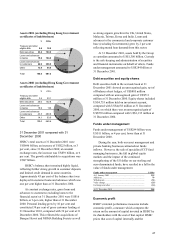
Assets 2001 (excluding Hong Kong Government
certificates of indebtedness)
%US$bn
Treasury and other
eligible bills 2.6 18.0
Debt securities 23.4 160.6
Loans and advances
to banks 15.2 104.6
Loans and advances
to customers 44.9 308.6
Other 13.9 95.4
Total 100.0 687.2
Assets 2000 (excluding Hong Kong Government
certificates of indebtedness)
%US$bn
Treasury and other
eligible bills 3.5 23.1
Debt securities 20.0 132.8
Loans and advances
to banks 18.9 126
Loans and advances
to customers 43.5 289.8
Other 14.1 93.9
Total 100.0 665.6
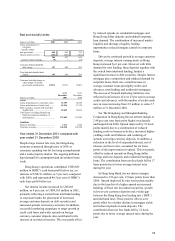
31 December 2001 compared with 31
December 2000
HSBC’s total assets at 31 December 2001 were
US$696 billion, an increase of US$22 billion, or 3
per cent, since 31 December 2000; at constant
exchange rates, the increase was US$39 billion, or 6
per cent. The growth attributable to acquisitions was
US$7 billion.
HSBC’s balance sheet remained highly liquid,
reflecting further strong growth in customer deposits
and limited credit demand in some countries.
Approximately 45 per cent of the balance sheet was
deployed in customer loans and advances which was
one per cent higher than at 31 December 2000.
At constant exchange rates, gross loans and
advances to customers (excluding loans to the
financial sector) at 31 December 2001 were US$16
billion, or 6 per cent, higher than at 31 December
2000. Personal lending grew by 10 per cent and
constituted 39 per cent of gross customer lending at
31 December 2001, compared with 39 per cent at 31
December 2000. This reflected the acquisitions of
Banque Hervet and NRMA Building Society as well
as strong organic growth in the UK, United States,
Malaysia, Taiwan, Korea and India. Loans and
advances to the commercial and corporate customer
base (excluding Governments) grew by 2 per cent
reflecting muted loan demand from this sector.
At 31 December 2001, assets held by the Group
as custodian amounted to US$1,300 billion. Custody
is the safe-keeping and administration of securities
and financial instruments on behalf of others. Funds
under management amounted to US$284 billion at
31 December 2001.
Debt securities and equity shares
Debt securities held in the accruals book at 31
December 2001 showed an unrecognised gain, net of
off-balance-sheet hedges, of US$885 million
compared with an unrecognised gain of US$711
million at 31 December 2000. Equity shares included
US$4,755 million held on investment account,
compared with US$4,638 million at 31 December
2000, on which there was an unrecognised gain of
US$539 million compared with US$1,135 million at
31 December 2000.
Funds under management
Funds under management of US$284 billion were
US$11 billion, or 4 per cent, lower than at 31
December 2000.
During the year, both our asset management and
private banking businesses attracted net funds
inflows. However, the sale of specialised CCF fund
managing businesses, the fall in global equity
markets and the impact of the continued
strengthening of the US dollar on our sterling and
euro denominated funds, have resulted in a fall in the
value of funds under management.
Funds under management US$bn
At 1 January 2001 ................................................................ 295
Additions ............................................................................. 79
Withdrawals......................................................................... (51 )
Value change........................................................................ (25)
Exchange and othe
r
.............................................................. (14 )
At 31 December 2001 .......................................................... 284
Economic profit
HSBC’s internal performance measures include
economic profit, a measure which compares the
return on the amount of capital invested in HSBC by
its shareholders with the cost of that capital. HSBC
prices that cost of capital internally and the