HSBC 2001 Annual Report Download - page 70
Download and view the complete annual report
Please find page 70 of the 2001 HSBC annual report below. You can navigate through the pages in the report by either clicking on the pages listed below, or by using the keyword search tool below to find specific information within the annual report.-
 1
1 -
2
-
3
-
4
-
5
-
6
-
7
-
8
-
9
-
10
-
11
-
12
-
13
-
14
-
15
-
16
-
17
-
18
-
19
-
20
-
21
-
22
-
23
-
24
-
25
-
26
-
27
-
28
-
29
-
30
-
31
-
32
-
33
-
34
-
35
-
36
-
37
-
38
-
39
-
40
-
41
-
42
-
43
-
44
-
45
-
46
-
47
-
48
-
49
-
50
-
51
-
52
-
53
-
54
-
55
-
56
-
57
-
58
-
59
-
 60
60 -
 61
61 -
 62
62 -
 63
63 -
 64
64 -
 65
65 -
 66
66 -
 67
67 -
 68
68 -
 69
69 -
 70
70 -
 71
71 -
 72
72 -
 73
73 -
 74
74 -
 75
75 -
 76
76 -
 77
77 -
 78
78 -
 79
79 -
 80
80 -
81
-
82
-
83
-
84
-
85
-
86
-
87
-
88
-
89
-
90
-
91
-
92
-
93
-
94
-
95
-
96
-
97
-
98
-
99
-
100
-
101
-
102
-
103
-
104
-
105
-
106
-
107
-
108
-
109
-
110
-
111
-
112
-
113
-
114
-
115
-
116
-
117
-
118
-
119
-
120
-
121
-
122
-
123
-
124
-
125
-
126
-
127
-
128
-
129
-
130
-
131
-
132
-
133
-
134
-
135
-
136
-
137
-
138
-
139
-
140
-
141
-
142
-
143
-
144
-
145
-
146
-
147
-
148
-
149
-
150
-
151
-
152
-
153
-
154
-
155
-
156
-
157
-
158
-
159
-
160
-
161
-
162
-
163
-
164
-
165
-
166
-
167
-
168
-
169
-
170
-
171
-
172
-
173
-
174
-
175
-
176
-
177
-
178
-
179
-
180
-
181
-
182
-
183
-
184
-
185
-
186
-
187
-
188
-
189
-
190
-
191
-
192
-
193
-
194
-
195
-
196
-
197
-
198
-
199
-
200
-
201
-
202
-
203
-
204
-
205
-
206
-
207
-
208
-
209
-
210
-
211
-
212
-
213
-
214
-
215
-
216
-
217
-
218
-
219
-
220
-
221
-
222
-
223
-
224
-
225
-
226
-
227
-
228
-
229
-
230
-
231
-
232
-
233
-
234
-
235
-
236
-
237
-
238
-
239
-
240
-
241
-
242
-
243
-
244
-
245
-
246
-
247
-
248
-
249
-
250
-
251
-
252
-
253
-
254
-
255
-
256
-
257
-
258
-
259
-
260
-
261
-
262
-
263
-
264
-
265
-
266
-
267
-
268
-
269
-
270
-
271
-
272
-
273
-
274
-
275
-
276
-
277
-
278
-
279
-
280
-
281
-
282
-
283
-
284
 |
 |

HSBC HOLDINGS PLC
Financial Review (continued)
68
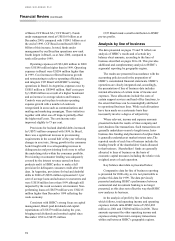
per cent over 1999.
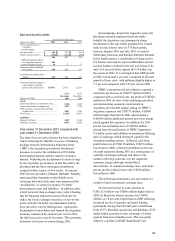
Provisions for bad and doubtful debts were
US$39 million higher than in 1999. In the United
States, provisions were made in 2000 of US$138
million, compared with US$90 million in 1999,
partly attributable to some deterioration in the quality
of leveraged credits which constitute a small portion
of outstanding advances. The allowance for credit
losses of over US$500 million represents coverage
against non-accrual loans of 124 per cent. In Canada,
due to the continuing strong economy and good
credit quality, provisions for credit losses remained
low.
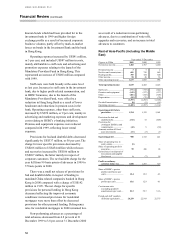
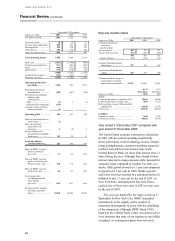
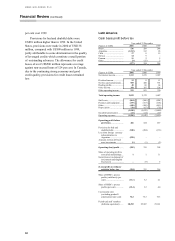
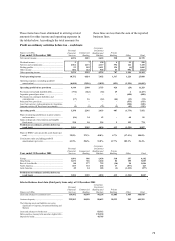
Latin America
Cash basis profit before tax
Year ended 31 December
Figures in US$m 2001 2000 1999
Brazil.................................... 136 208 244
Argentina.............................. (1,152 ) 112 65
Chile .................................... 17 812
Mexico ................................. 14 9
–
Panama ................................. 11 25
Othe
r
.................................... (3) (15 ) 2
(977) 324 328
Year ended 31 December
Figures in US$m 2001 2000 1999
Net interest income............... 1,113 1,219 1,097
Dividend income .................. 12 811
Net fees and commissions..... 509 480 391
Dealing profits...................... 40 68 64
Other income ........................ 358 397 324
Other operating income ........ 919 953 790
Total operating income 2,032 2,172 1,887
Staff costs............................. (864 ) (906) (801)
Premises and equipmen
t
....... (159) (167) (148 )
Othe
r
.................................... (448) (495) (415 )
Depreciatio
n
......................... (78 ) (67 ) (76)
(1,549) (1,635 ) (1,440)
Goodwill amortisatio
n
.......... (17 ) (13 ) (10)
Operating expenses............... (1,566) (1,648 ) (1,450)
Operating profit before
provisions........................ 466 524 437
Provisions for bad and
doubtful debts .................. (940 ) (204) (133)
Loss from foreign currency
redenomination in
Argentina ......................... (520)
–
–
Amounts written off fixed
asset investments ............. (1) (1 ) (2)
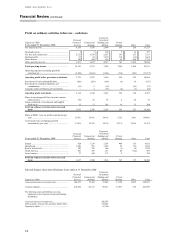
Operating (loss)/profit ........ (995) 319 302
Share of operating profit in
associated undertakings.... 1111
Gains/(losses) on disposal o
f
investments and tangible
fixed assets ...................... –(9 ) 5
(Loss)/profit on ordinary
activities before ta
x
........ (994) 311 318
Share of HSBC’ s pre-tax
profits (cash basis) (per
cent)................................. (11.1) 3.2 4.1
Share of HSBC’ s pre-tax
p
rofits (per cent) .............. (12.4 ) 3.2 4.0
Cost:income ratio
(excluding goodwill
amortisation) (per cent) 76.2 75.3 76.3
Period-end staff numbers
(full-time equivalent) ....... 28,292 25,907 27,181