HSBC 2001 Annual Report Download - page 242
Download and view the complete annual report
Please find page 242 of the 2001 HSBC annual report below. You can navigate through the pages in the report by either clicking on the pages listed below, or by using the keyword search tool below to find specific information within the annual report.-
 1
1 -
2
-
3
-
4
-
5
-
6
-
7
-
8
-
9
-
10
-
11
-
12
-
13
-
14
-
15
-
16
-
17
-
18
-
19
-
20
-
21
-
22
-
23
-
24
-
25
-
26
-
27
-
28
-
29
-
30
-
31
-
32
-
33
-
34
-
35
-
36
-
37
-
38
-
39
-
40
-
41
-
42
-
43
-
44
-
45
-
46
-
47
-
48
-
49
-
50
-
51
-
52
-
53
-
54
-
55
-
56
-
57
-
58
-
59
-
60
-
61
-
62
-
63
-
64
-
65
-
66
-
67
-
68
-
69
-
70
-
71
-
72
-
73
-
74
-
75
-
76
-
77
-
78
-
79
-
80
-
81
-
82
-
83
-
84
-
85
-
86
-
87
-
88
-
89
-
90
-
91
-
92
-
93
-
94
-
95
-
96
-
97
-
98
-
99
-
100
-
101
-
102
-
103
-
104
-
105
-
106
-
107
-
108
-
109
-
110
-
111
-
112
-
113
-
114
-
115
-
116
-
117
-
118
-
119
-
120
-
121
-
122
-
123
-
124
-
125
-
126
-
127
-
128
-
129
-
130
-
131
-
132
-
133
-
134
-
135
-
136
-
137
-
138
-
139
-
140
-
141
-
142
-
143
-
144
-
145
-
146
-
147
-
148
-
149
-
150
-
151
-
152
-
153
-
154
-
155
-
156
-
157
-
158
-
159
-
160
-
161
-
162
-
163
-
164
-
165
-
166
-
167
-
168
-
169
-
170
-
171
-
172
-
173
-
174
-
175
-
176
-
177
-
178
-
179
-
180
-
181
-
182
-
183
-
184
-
185
-
186
-
187
-
188
-
189
-
190
-
191
-
192
-
193
-
194
-
195
-
196
-
197
-
198
-
199
-
200
-
201
-
202
-
203
-
204
-
205
-
206
-
207
-
208
-
209
-
210
-
211
-
212
-
213
-
214
-
215
-
216
-
217
-
218
-
219
-
220
-
221
-
222
-
223
-
224
-
225
-
226
-
227
-
228
-
229
-
230
-
231
-
 232
232 -
 233
233 -
 234
234 -
 235
235 -
 236
236 -
 237
237 -
 238
238 -
 239
239 -
 240
240 -
 241
241 -
 242
242 -
 243
243 -
 244
244 -
 245
245 -
 246
246 -
 247
247 -
 248
248 -
 249
249 -
 250
250 -
 251
251 -
 252
252 -
253
-
254
-
255
-
256
-
257
-
258
-
259
-
260
-
261
-
262
-
263
-
264
-
265
-
266
-
267
-
268
-
269
-
270
-
271
-
272
-
273
-
274
-
275
-
276
-
277
-
278
-
279
-
280
-
281
-
282
-
283
-
284
 |
 |

HSBC HOLDINGS PLC
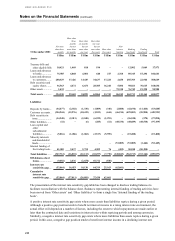
Notes on the Financial Statements (continued)
240
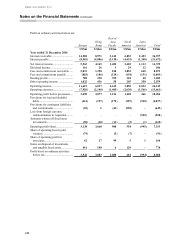
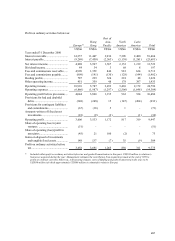
Profit on ordinary activities before tax:
Europe
H
on
g
K
on
g
R
est o
f
Asia-
Pacific North
America Latin
America Tota
l
US$m US$m US$m US$m US$m US$m
Year ended 31 December 2001
Interest receivable............................. 14,508 8,971 3,612 6,853 2,453 36,397
Interest payable................................. (8,945) (4,806) (2,130) (4,451) (1,340) (21,672)
Net interest income ........................... 5,563 4,165 1,482 2,402 1,113 14,725
Dividend income............................... 116 26 3 29 12 186
Fees and commissions receivable ..... 5,013 1,358 810 1,052 640 8,873
Fees and commissions payable ......... (803) (186) (129) (154) (131) (1,403)
Dealing profits .................................. 708 218 395 324 40 1,685
Other operating income .................... 1,022 436 58 205 358 2,079
Operating income.............................. 11,619 6,017 2,619 3,858 2,032 26,145
Operating expenses........................... (7,920) (2,140) (1,405) (2,630) (1,566) (15,661)
Operating profit before provisions.... 3,699 3,877 1,214 1,228 466 10,484
Provisions for bad and doubtful
debts .............................................. (441) (197) (172) (287) (940) (2,037)
Provisions for contingent liabilities
and commitments .......................... (30) 6 (43) (582)
–
(649)
Loss from foreign currency
redenomination in Argentina......... –
–
––(520) (520)
Amounts written off fixed asset
investments.................................... (90 ) (18) (11) (5) (1) (125 )
Operating profit/(loss)....................... 3,138 3,668 988 354 (995) 7,153
Share of operating loss in joint
ventures ........................................ (79)
–
(5) (7)
–
(91)
Share of operating profit in
associates....................................... 42 17 99 5 1 164
Gains on disposal of investments
and tangible fixed assets................ 441 198 6 129
–
774
Profit/(loss) on ordinary activities
before tax....................................... 3,542 3,883 1,088 481 (994) 8,000