HSBC 2001 Annual Report Download - page 181
Download and view the complete annual report
Please find page 181 of the 2001 HSBC annual report below. You can navigate through the pages in the report by either clicking on the pages listed below, or by using the keyword search tool below to find specific information within the annual report.-
 1
1 -
2
-
3
-
4
-
5
-
6
-
7
-
8
-
9
-
10
-
11
-
12
-
13
-
14
-
15
-
16
-
17
-
18
-
19
-
20
-
21
-
22
-
23
-
24
-
25
-
26
-
27
-
28
-
29
-
30
-
31
-
32
-
33
-
34
-
35
-
36
-
37
-
38
-
39
-
40
-
41
-
42
-
43
-
44
-
45
-
46
-
47
-
48
-
49
-
50
-
51
-
52
-
53
-
54
-
55
-
56
-
57
-
58
-
59
-
60
-
61
-
62
-
63
-
64
-
65
-
66
-
67
-
68
-
69
-
70
-
71
-
72
-
73
-
74
-
75
-
76
-
77
-
78
-
79
-
80
-
81
-
82
-
83
-
84
-
85
-
86
-
87
-
88
-
89
-
90
-
91
-
92
-
93
-
94
-
95
-
96
-
97
-
98
-
99
-
100
-
101
-
102
-
103
-
104
-
105
-
106
-
107
-
108
-
109
-
110
-
111
-
112
-
113
-
114
-
115
-
116
-
117
-
118
-
119
-
120
-
121
-
122
-
123
-
124
-
125
-
126
-
127
-
128
-
129
-
130
-
131
-
132
-
133
-
134
-
135
-
136
-
137
-
138
-
139
-
140
-
141
-
142
-
143
-
144
-
145
-
146
-
147
-
148
-
149
-
150
-
151
-
152
-
153
-
154
-
155
-
156
-
157
-
158
-
159
-
160
-
161
-
162
-
163
-
164
-
165
-
166
-
167
-
168
-
169
-
170
-
 171
171 -
 172
172 -
 173
173 -
 174
174 -
 175
175 -
 176
176 -
 177
177 -
 178
178 -
 179
179 -
 180
180 -
 181
181 -
 182
182 -
 183
183 -
 184
184 -
 185
185 -
 186
186 -
 187
187 -
 188
188 -
 189
189 -
 190
190 -
 191
191 -
192
-
193
-
194
-
195
-
196
-
197
-
198
-
199
-
200
-
201
-
202
-
203
-
204
-
205
-
206
-
207
-
208
-
209
-
210
-
211
-
212
-
213
-
214
-
215
-
216
-
217
-
218
-
219
-
220
-
221
-
222
-
223
-
224
-
225
-
226
-
227
-
228
-
229
-
230
-
231
-
232
-
233
-
234
-
235
-
236
-
237
-
238
-
239
-
240
-
241
-
242
-
243
-
244
-
245
-
246
-
247
-
248
-
249
-
250
-
251
-
252
-
253
-
254
-
255
-
256
-
257
-
258
-
259
-
260
-
261
-
262
-
263
-
264
-
265
-
266
-
267
-
268
-
269
-
270
-
271
-
272
-
273
-
274
-
275
-
276
-
277
-
278
-
279
-
280
-
281
-
282
-
283
-
284
 |
 |

179
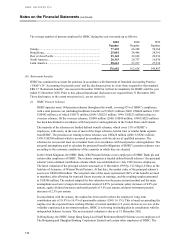
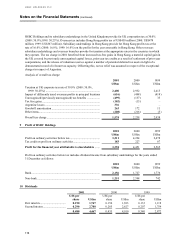
Of the first interim dividend for 2001, US$129 million (2000: US$476 million; 1999: US$229 million) was settled
by the issue of shares. Of the second interim dividend for 2000, US$737 million; (1999: US$468 million, 1998:
US$450 million) was settled by the issue of shares in 2001.
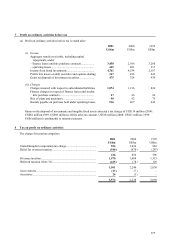
11 Earnings per ordinary share
Basic earnings per ordinary share was calculated by dividing the earnings of US$5,406 million (2000: US$6,628
million; 1999: US$5,408 million) by the weighted average number of ordinary shares, excluding own shares held,
outstanding in 2001 of 9,237 million (2000: 8,777 million; 1999: 8,296 million).
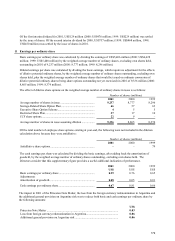
Diluted earnings per share was calculated by dividing the basic earnings, which require no adjustment for the effects
of dilutive potential ordinary shares, by the weighted average number of ordinary shares outstanding, excluding own
shares held, plus the weighted average number of ordinary shares that would be issued on ordinary conversion of
dilutive potential ordinary shares (being share options outstanding not yet exercised) in 2001 of 9,336 million (2000:
8,865 million; 1999: 8,374 million).
The effect of dilutive share options on the weighted average number of ordinary shares in issue is as follows:
Number of shares (millions)
2001 2000 1999
Average number of shares in issue ............................................... 9,237 8,777 8,296
Savings-Related Share Option Plan .............................................. 46 57 63
Executive Share Option Scheme................................................... 455
Restricted Share Plan .................................................................... 27 17 10
CCF share options......................................................................... 22 9–
Average number of shares in issue assuming dilution .................. 9,336 8,865 8,374
Of the total number of employee share options existing at year-end, the following were not included in the dilution
calculation above because they were antidilutive:
Number of shares (millions)
2001 2000 1999
Antidilutive share options............................................................. ––79
The cash earnings per share was calculated by dividing the basic earnings, after adding back the amortisation of
goodwill, by the weighted average number of ordinary shares outstanding, excluding own shares held. The
Directors consider that this supplementary figure provides a useful additional indication of performance.
2001 2000 1999
US$ US$ US$
Basic earnings per ordinary share ................................................. 0.59 0.76 0.65
Adjustments:
Amortisation of goodwill.............................................................. 0.08 0.05 0.01
Cash earnings per ordinary share .................................................. 0.67 0.81 0.66
The impact in 2001 of the Princeton Note Matter, the loss from the foreign currency redenomination in Argentina and
the additional general provision on Argentine risk was to reduce both basic and cash earnings per ordinary share by
the following amounts:
US$
Princeton Note Matter .................................................................................................. 0.03
Loss from foreign currency redenomination in Argentina............................................ 0.06
Additional general provision on Argentine risk ........................................................... 0.06