HSBC 2001 Annual Report Download - page 225
Download and view the complete annual report
Please find page 225 of the 2001 HSBC annual report below. You can navigate through the pages in the report by either clicking on the pages listed below, or by using the keyword search tool below to find specific information within the annual report.-
 1
1 -
2
-
3
-
4
-
5
-
6
-
7
-
8
-
9
-
10
-
11
-
12
-
13
-
14
-
15
-
16
-
17
-
18
-
19
-
20
-
21
-
22
-
23
-
24
-
25
-
26
-
27
-
28
-
29
-
30
-
31
-
32
-
33
-
34
-
35
-
36
-
37
-
38
-
39
-
40
-
41
-
42
-
43
-
44
-
45
-
46
-
47
-
48
-
49
-
50
-
51
-
52
-
53
-
54
-
55
-
56
-
57
-
58
-
59
-
60
-
61
-
62
-
63
-
64
-
65
-
66
-
67
-
68
-
69
-
70
-
71
-
72
-
73
-
74
-
75
-
76
-
77
-
78
-
79
-
80
-
81
-
82
-
83
-
84
-
85
-
86
-
87
-
88
-
89
-
90
-
91
-
92
-
93
-
94
-
95
-
96
-
97
-
98
-
99
-
100
-
101
-
102
-
103
-
104
-
105
-
106
-
107
-
108
-
109
-
110
-
111
-
112
-
113
-
114
-
115
-
116
-
117
-
118
-
119
-
120
-
121
-
122
-
123
-
124
-
125
-
126
-
127
-
128
-
129
-
130
-
131
-
132
-
133
-
134
-
135
-
136
-
137
-
138
-
139
-
140
-
141
-
142
-
143
-
144
-
145
-
146
-
147
-
148
-
149
-
150
-
151
-
152
-
153
-
154
-
155
-
156
-
157
-
158
-
159
-
160
-
161
-
162
-
163
-
164
-
165
-
166
-
167
-
168
-
169
-
170
-
171
-
172
-
173
-
174
-
175
-
176
-
177
-
178
-
179
-
180
-
181
-
182
-
183
-
184
-
185
-
186
-
187
-
188
-
189
-
190
-
191
-
192
-
193
-
194
-
195
-
196
-
197
-
198
-
199
-
200
-
201
-
202
-
203
-
204
-
205
-
206
-
207
-
208
-
209
-
210
-
211
-
212
-
213
-
214
-
 215
215 -
 216
216 -
 217
217 -
 218
218 -
 219
219 -
 220
220 -
 221
221 -
 222
222 -
 223
223 -
 224
224 -
 225
225 -
 226
226 -
 227
227 -
 228
228 -
 229
229 -
 230
230 -
 231
231 -
 232
232 -
 233
233 -
 234
234 -
 235
235 -
236
-
237
-
238
-
239
-
240
-
241
-
242
-
243
-
244
-
245
-
246
-
247
-
248
-
249
-
250
-
251
-
252
-
253
-
254
-
255
-
256
-
257
-
258
-
259
-
260
-
261
-
262
-
263
-
264
-
265
-
266
-
267
-
268
-
269
-
270
-
271
-
272
-
273
-
274
-
275
-
276
-
277
-
278
-
279
-
280
-
281
-
282
-
283
-
284
 |
 |

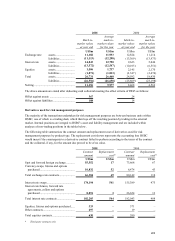
223
2001 2000
Mark-to-
market values
at year en
d
Average
mark-to-
market values
for the year
Mark-to-
market values
at year en
d
Average
mark-to-
market values
for the year
US$m US$m US$m US$m
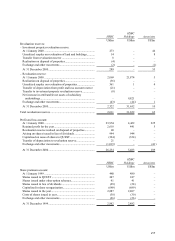
Exchange rate assets.......................... 11,182 11,933 12,824 11,214
liabilities .................... (11,113) (12,298)(13,309) (13,973)
Interest rate assets.......................... 14,043 12,790 9,623 5,046
liabilities .................... (13,572) (12,547)(10,013) (6,551)
Equities assets.......................... 1,506 1,737 2,145 2,170
liabilities .................... (1,871) (1,813)(2,347) (2,674)
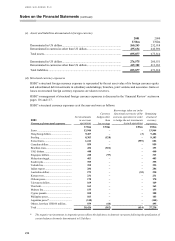
Total assets.......................... 26,731 26,460 24,592 18,430
liabilities .................... (26,556) (26,658) (25,669) (23,198)
Netting ....................................................... 11,156 9,977 8,468 4,562
The above amounts are stated after deducting cash collateral meeting the offset criteria of FRS5 as follows:
Offset against assets .................................. 367 24
Offset against liabilities ............................. 108 14
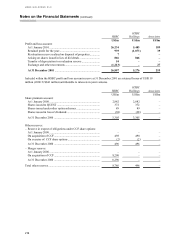
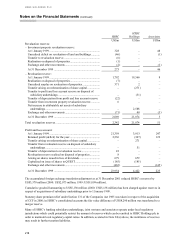
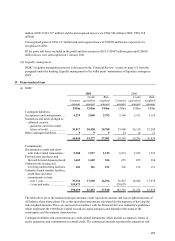
Derivatives used for risk management purposes
The majority of the transactions undertaken for risk management purposes are between business units within
HSBC, one of which is a trading desk, which then lays off the resulting position by trading in the external
market. Internal positions are integral to HSBC’ s asset and liability management and are included within
analyses of non-trading positions in the tables below.
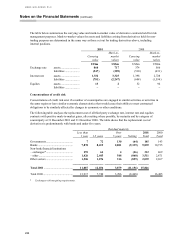
The following table summarises the contract amount and replacement cost of derivatives used for risk
management purposes by product type. The replacement cost shown represents the accounting loss HSBC
would incur if the counterparty to a derivative contract failed to perform according to the terms of the contract
and the collateral, if any, for the amount due proved to be of no value.
2001 2000
Contrac
t
amoun
t
R
eplacemen
t
cos
t
*Contrac
t
amoun
t
R
eplacemen
t
cos
t
*
US$m US$m US$m US$m
Spot and forward foreign exchange ........... 55,552 17 73,668 67
Currency swaps, futures and options
purchased ............................................... 10,832 52 6,474 43
Total exchange rate contracts..................... 66,384 69 80,142 110
Interest rate swaps...................................... 174,194 541 155,389 475
Interest rate futures, forward rate
agreements, collars and options
purchased ............................................... 8,091 3 26,654 13
Total interest rate contracts........................ 182,285 544 182,043 488
Equities, futures and options purchased..... 333
–
571
–
Other contracts........................................... 297
–
19
–
Total equities contracts .............................. 630
–
590
–
*Third party contracts only