HSBC 2001 Annual Report Download - page 224
Download and view the complete annual report
Please find page 224 of the 2001 HSBC annual report below. You can navigate through the pages in the report by either clicking on the pages listed below, or by using the keyword search tool below to find specific information within the annual report.-
 1
1 -
2
-
3
-
4
-
5
-
6
-
7
-
8
-
9
-
10
-
11
-
12
-
13
-
14
-
15
-
16
-
17
-
18
-
19
-
20
-
21
-
22
-
23
-
24
-
25
-
26
-
27
-
28
-
29
-
30
-
31
-
32
-
33
-
34
-
35
-
36
-
37
-
38
-
39
-
40
-
41
-
42
-
43
-
44
-
45
-
46
-
47
-
48
-
49
-
50
-
51
-
52
-
53
-
54
-
55
-
56
-
57
-
58
-
59
-
60
-
61
-
62
-
63
-
64
-
65
-
66
-
67
-
68
-
69
-
70
-
71
-
72
-
73
-
74
-
75
-
76
-
77
-
78
-
79
-
80
-
81
-
82
-
83
-
84
-
85
-
86
-
87
-
88
-
89
-
90
-
91
-
92
-
93
-
94
-
95
-
96
-
97
-
98
-
99
-
100
-
101
-
102
-
103
-
104
-
105
-
106
-
107
-
108
-
109
-
110
-
111
-
112
-
113
-
114
-
115
-
116
-
117
-
118
-
119
-
120
-
121
-
122
-
123
-
124
-
125
-
126
-
127
-
128
-
129
-
130
-
131
-
132
-
133
-
134
-
135
-
136
-
137
-
138
-
139
-
140
-
141
-
142
-
143
-
144
-
145
-
146
-
147
-
148
-
149
-
150
-
151
-
152
-
153
-
154
-
155
-
156
-
157
-
158
-
159
-
160
-
161
-
162
-
163
-
164
-
165
-
166
-
167
-
168
-
169
-
170
-
171
-
172
-
173
-
174
-
175
-
176
-
177
-
178
-
179
-
180
-
181
-
182
-
183
-
184
-
185
-
186
-
187
-
188
-
189
-
190
-
191
-
192
-
193
-
194
-
195
-
196
-
197
-
198
-
199
-
200
-
201
-
202
-
203
-
204
-
205
-
206
-
207
-
208
-
209
-
210
-
211
-
212
-
213
-
 214
214 -
 215
215 -
 216
216 -
 217
217 -
 218
218 -
 219
219 -
 220
220 -
 221
221 -
 222
222 -
 223
223 -
 224
224 -
 225
225 -
 226
226 -
 227
227 -
 228
228 -
 229
229 -
 230
230 -
 231
231 -
 232
232 -
 233
233 -
 234
234 -
235
-
236
-
237
-
238
-
239
-
240
-
241
-
242
-
243
-
244
-
245
-
246
-
247
-
248
-
249
-
250
-
251
-
252
-
253
-
254
-
255
-
256
-
257
-
258
-
259
-
260
-
261
-
262
-
263
-
264
-
265
-
266
-
267
-
268
-
269
-
270
-
271
-
272
-
273
-
274
-
275
-
276
-
277
-
278
-
279
-
280
-
281
-
282
-
283
-
284
 |
 |

HSBC HOLDINGS PLC
Notes on the Financial Statements (continued)
222
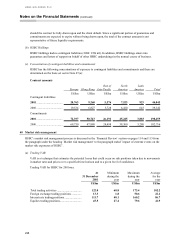
Credit risk
Unlike assets recorded on the balance sheet, where the credit risk is typically the full amount of the principal
value, together with any unrealised interest accrued or mark-to-market gain (Note 14), the credit risk relative to
a derivative is principally the replacement cost of any contract with a positive mark-to-market gain and an
estimate for the potential future change in value, reflecting the volatilities affecting the contract. Credit risk on
contracts having a negative mark-to-market value is restricted to the potential future change in value. Credit risk
on derivatives is, therefore, small in relation to a comparable balance sheet risk. In addition, credit exposure
with individual counterparties can be reduced by the receipt of collateral and close-out netting agreements
which allow for positive and negative mark-to-market values on different transactions to be offset and settled by
a single payment in the event of default by either party. Such agreements are enforceable in the jurisdictions of
the major market makers and HSBC has executed close-out netting agreements with the majority of its
counterparties, notwithstanding the fact that HSBC deals only with the most creditworthy counterparties.
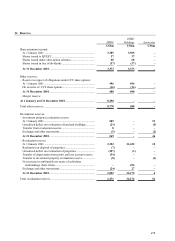
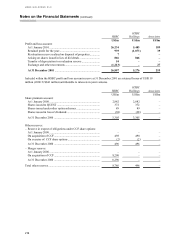
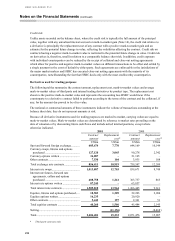
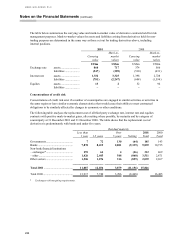
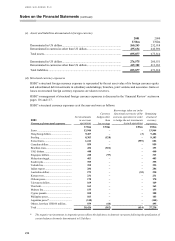
Derivatives used for trading purposes
The following tables summarise the contract amount, replacement cost, mark-to-market values and average
mark-to-market values of third party and internal trading derivatives by product type. The replacement cost
shown is the positive mark-to-market value and represents the accounting loss HSBC would incur if the
counterparty to a derivative contract failed to perform according to the terms of the contract and the collateral, if
any, for the amount due proved to be of no value.
The notional or contractual amounts of these instruments indicate the volume of transactions outstanding at the
balance sheet date; they do not represent amounts at risk.
Because all derivative instruments used for trading purposes are marked to market, carrying values are equal to
mark-to-market values. Mark-to-market values are determined by reference to market rates prevailing on the
date of valuation or by discounting future cash flows and include netted internal positions, except where
otherwise indicated.
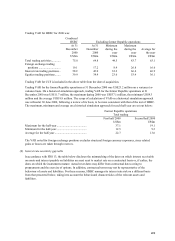
2001 2000
Contrac
t
amoun
t
R
eplacemen
t
cos
t
*
Contrac
t
amoun
t
R
eplacemen
t
cos
t
*
US$m US$m US$m US$m
Spot and forward foreign exchange ........... 685,674 7,770 644,169 10,149
Currency swaps, futures and options
purchased ............................................... 127,120 3,045 90,278 2,342
Currency options written ........................... 36,087
–
21,165
–
Other contracts........................................... 7,530 104 3,935 108
Total exchange rate contracts..................... 856,411 10,919 759,547 12,599
Interest rate swaps...................................... 1,013,807 12,703 839,671 8,748
Interest rate futures, forward rate
agreements, collars and options
purchased ............................................... 408,758 1,261 363,737 863
Interest rate options written ....................... 87,245
–
63,037
–
Total interest rate contracts........................ 1,509,810 13,964 1,266,445 9,611
Equities, futures and options purchased..... 18,583 1,309 22,203 2,094
Equities options written ............................. 16,235
–
20,920
–
Other contracts........................................... 5,442 197 2,361 51
Total equities contracts .............................. 40,260 1,506 45,484 2,145
Netting ....................................................... (11,156) (8,468)
Total........................................................... 2,406,481 15,233 2,071,476 15,887
*Third party contracts only