HSBC 2001 Annual Report Download - page 175
Download and view the complete annual report
Please find page 175 of the 2001 HSBC annual report below. You can navigate through the pages in the report by either clicking on the pages listed below, or by using the keyword search tool below to find specific information within the annual report.-
 1
1 -
2
-
3
-
4
-
5
-
6
-
7
-
8
-
9
-
10
-
11
-
12
-
13
-
14
-
15
-
16
-
17
-
18
-
19
-
20
-
21
-
22
-
23
-
24
-
25
-
26
-
27
-
28
-
29
-
30
-
31
-
32
-
33
-
34
-
35
-
36
-
37
-
38
-
39
-
40
-
41
-
42
-
43
-
44
-
45
-
46
-
47
-
48
-
49
-
50
-
51
-
52
-
53
-
54
-
55
-
56
-
57
-
58
-
59
-
60
-
61
-
62
-
63
-
64
-
65
-
66
-
67
-
68
-
69
-
70
-
71
-
72
-
73
-
74
-
75
-
76
-
77
-
78
-
79
-
80
-
81
-
82
-
83
-
84
-
85
-
86
-
87
-
88
-
89
-
90
-
91
-
92
-
93
-
94
-
95
-
96
-
97
-
98
-
99
-
100
-
101
-
102
-
103
-
104
-
105
-
106
-
107
-
108
-
109
-
110
-
111
-
112
-
113
-
114
-
115
-
116
-
117
-
118
-
119
-
120
-
121
-
122
-
123
-
124
-
125
-
126
-
127
-
128
-
129
-
130
-
131
-
132
-
133
-
134
-
135
-
136
-
137
-
138
-
139
-
140
-
141
-
142
-
143
-
144
-
145
-
146
-
147
-
148
-
149
-
150
-
151
-
152
-
153
-
154
-
155
-
156
-
157
-
158
-
159
-
160
-
161
-
162
-
163
-
164
-
 165
165 -
 166
166 -
 167
167 -
 168
168 -
 169
169 -
 170
170 -
 171
171 -
 172
172 -
 173
173 -
 174
174 -
 175
175 -
 176
176 -
 177
177 -
 178
178 -
 179
179 -
 180
180 -
 181
181 -
 182
182 -
 183
183 -
 184
184 -
 185
185 -
186
-
187
-
188
-
189
-
190
-
191
-
192
-
193
-
194
-
195
-
196
-
197
-
198
-
199
-
200
-
201
-
202
-
203
-
204
-
205
-
206
-
207
-
208
-
209
-
210
-
211
-
212
-
213
-
214
-
215
-
216
-
217
-
218
-
219
-
220
-
221
-
222
-
223
-
224
-
225
-
226
-
227
-
228
-
229
-
230
-
231
-
232
-
233
-
234
-
235
-
236
-
237
-
238
-
239
-
240
-
241
-
242
-
243
-
244
-
245
-
246
-
247
-
248
-
249
-
250
-
251
-
252
-
253
-
254
-
255
-
256
-
257
-
258
-
259
-
260
-
261
-
262
-
263
-
264
-
265
-
266
-
267
-
268
-
269
-
270
-
271
-
272
-
273
-
274
-
275
-
276
-
277
-
278
-
279
-
280
-
281
-
282
-
283
-
284
 |
 |

173
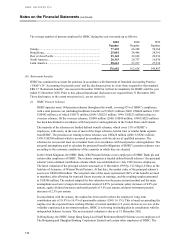
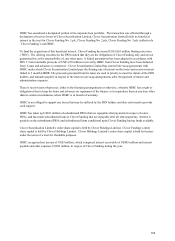
scheme comprises a funded defined benefit scheme and a defined contribution scheme. The latter was
established on 1 January 1999 for new employees. The latest valuation of the defined benefit scheme was
made at 31 December 2001 and was performed by E Chiu, Fellow of the Society of Actuaries of the
United States of America, of HSBC Life (International) Limited, a subsidiary of HSBC Holdings. At that
date, the market value of the defined benefit scheme’ s assets was US$815 million. On an ongoing basis,
the actuarial value of the scheme’ s assets represented 112% of the benefits accrued to members, after
allowing for expected future increases in salaries, and the resulting surplus amounted to US$90 million.
On a wind-up basis, the actuarial value of the scheme’ s assets represents 120% of the members’ vested
benefits, based on current salaries, and the resulting surplus amounted to US$135 million. The actuarial
method used was the projected unit credit method and the main assumptions used in this valuation were a
long-term investment return of 7% per annum and salary increases of 6% per annum.
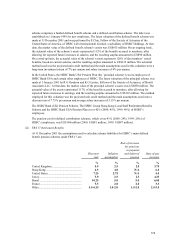
In the United States, the HSBC Bank USA Pension Plan (the ‘principal scheme’ ) covers employees of
HSBC Bank USA and certain other employees of HSBC. The latest valuation of the principal scheme was
made at 1 January 2001 by R G Gendron and K G Leister, Fellows of the Society of Actuaries, of Hewitt
Associates LLC. At that date, the market value of the principal scheme’ s assets was US$850 million. The
actuarial value of the assets represented 117% of the benefits accrued to members, after allowing for
expected future increases in earnings, and the resulting surplus amounted to US$122 million. The method
employed for this valuation was the projected unit credit method and the main assumptions used were a
discount rate of 7.75% per annum and average salary increases of 5.15% per annum.
The HSBC Bank (UK) Pension Scheme, The HSBC Group Hong Kong Local Staff Retirement Benefits
Scheme and the HSBC Bank USA Pension Plan cover 42% (2000: 45%, 1999: 46%) of HSBC’ s
employees.
The pension cost for defined contribution schemes, which cover 41% (2000: 24%; 1999: 26%) of
HSBC’ s employees, was US$144 million (2000: US$81 million; 1999: US$87 million).
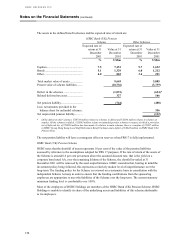
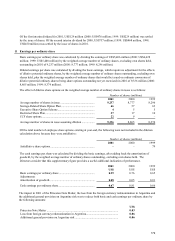
(ii) FRS 17 Retirement Benefits
At 31 December 2001 the assumptions used to calculate scheme liabilities for HSBC’ s main defined
benefit pension schemes under FRS 17 are:
D
iscoun
t
rate Inflation
assumption
Rate of increase
for pensions
in paymen
t
and deferre
d
pension Rate of pay
increase
%% % %
United Kingdom......................................... 5.9 2.5 2.5 3.75
Hong Kong ................................................. 6.5 4.0 N/A 6.0
United States .............................................. 7.25 2.75 N/A 4.0
Jersey.......................................................... 5.9 2.5 2.5 4.25
Brazil.......................................................... 10.25 5.0 5.0 6.05
France......................................................... 5.5 2.0 2.0 3.5
Other........................................................... 4.5-6.25 1.5-2.0 1.5-2.0 2.5-3.5