HSBC 2001 Annual Report Download - page 55
Download and view the complete annual report
Please find page 55 of the 2001 HSBC annual report below. You can navigate through the pages in the report by either clicking on the pages listed below, or by using the keyword search tool below to find specific information within the annual report.-
 1
1 -
2
-
3
-
4
-
5
-
6
-
7
-
8
-
9
-
10
-
11
-
12
-
13
-
14
-
15
-
16
-
17
-
18
-
19
-
20
-
21
-
22
-
23
-
24
-
25
-
26
-
27
-
28
-
29
-
30
-
31
-
32
-
33
-
34
-
35
-
36
-
37
-
38
-
39
-
40
-
41
-
42
-
43
-
44
-
 45
45 -
 46
46 -
 47
47 -
 48
48 -
 49
49 -
 50
50 -
 51
51 -
 52
52 -
 53
53 -
 54
54 -
 55
55 -
 56
56 -
 57
57 -
 58
58 -
 59
59 -
 60
60 -
 61
61 -
 62
62 -
 63
63 -
 64
64 -
 65
65 -
66
-
67
-
68
-
69
-
70
-
71
-
72
-
73
-
74
-
75
-
76
-
77
-
78
-
79
-
80
-
81
-
82
-
83
-
84
-
85
-
86
-
87
-
88
-
89
-
90
-
91
-
92
-
93
-
94
-
95
-
96
-
97
-
98
-
99
-
100
-
101
-
102
-
103
-
104
-
105
-
106
-
107
-
108
-
109
-
110
-
111
-
112
-
113
-
114
-
115
-
116
-
117
-
118
-
119
-
120
-
121
-
122
-
123
-
124
-
125
-
126
-
127
-
128
-
129
-
130
-
131
-
132
-
133
-
134
-
135
-
136
-
137
-
138
-
139
-
140
-
141
-
142
-
143
-
144
-
145
-
146
-
147
-
148
-
149
-
150
-
151
-
152
-
153
-
154
-
155
-
156
-
157
-
158
-
159
-
160
-
161
-
162
-
163
-
164
-
165
-
166
-
167
-
168
-
169
-
170
-
171
-
172
-
173
-
174
-
175
-
176
-
177
-
178
-
179
-
180
-
181
-
182
-
183
-
184
-
185
-
186
-
187
-
188
-
189
-
190
-
191
-
192
-
193
-
194
-
195
-
196
-
197
-
198
-
199
-
200
-
201
-
202
-
203
-
204
-
205
-
206
-
207
-
208
-
209
-
210
-
211
-
212
-
213
-
214
-
215
-
216
-
217
-
218
-
219
-
220
-
221
-
222
-
223
-
224
-
225
-
226
-
227
-
228
-
229
-
230
-
231
-
232
-
233
-
234
-
235
-
236
-
237
-
238
-
239
-
240
-
241
-
242
-
243
-
244
-
245
-
246
-
247
-
248
-
249
-
250
-
251
-
252
-
253
-
254
-
255
-
256
-
257
-
258
-
259
-
260
-
261
-
262
-
263
-
264
-
265
-
266
-
267
-
268
-
269
-
270
-
271
-
272
-
273
-
274
-
275
-
276
-
277
-
278
-
279
-
280
-
281
-
282
-
283
-
284
 |
 |
53
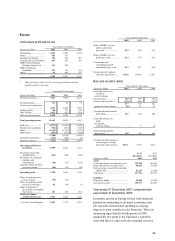
rates, cash earnings were US$925 million higher
than 1999, of which CCF contributed US$169
million, HSBC Republic Suisse, US$290 million and
RNYC and SRH, US$197 million. The following
commentary on Europe's results is based on constant
exchange rates.
Net interest income was US$1,040 million, or 26
per cent, higher at US$4,998 million of which some
US$800 million was attributable to the recent
acquisitions. The underlying increase was principally
attributable to growth in UK Banking and income
earned on funds raised in anticipation of the CCF
acquisition, together with smaller increases in
Offshore Banking and Turkey, the latter due to
increased spreads reflecting local market conditions.
These increases were partly offset by a US$147
million, or 40 per cent, decrease in Treasury and
Capital Markets’ money market business caused by a
flattening of the yield curve and higher short-term
funding costs, together with the maturing of high
yielding assets.
In UK Banking, net interest income at US$3,222
million was 6 per cent higher than 1999 reflecting
balance growth in personal and commercial current
accounts, personal savings and personal and
commercial lending. HSBC Bank plc’s repricing of
variable rate mortgages contributed to mortgage
growth of US$1.7 billion, with a decline in mortgage
spread. Spread was also reduced on savings products
reflecting competitive pricing. The effect on UK
Banking’s margin of the reduction in spread was
partly mitigated by a greater benefit from free funds.
Other operating income was US$1,335 million,
or 29 per cent, higher than in 1999 of which recent
acquisitions accounted for some US$750 million.
The underlying increase reflected growth in UK
Banking, Treasury and Capital Markets and
Investment Banking, together with smaller increases
in Offshore Banking, due to the successful launches
of funds products, and HSBC Trinkaus & Burkhardt
KGaA largely due to increased commission income
on equity transactions.
In UK Banking, other operating income at
US$3,001 million was 8 per cent higher than 1999,
primarily reflecting growth in wealth management
income and higher fee income from cards, corporate
banking and global safe custody fees. Wealth
management income showed a significant increase
compared with 1999, up 14 per cent, from US$673
million to US$764 million. Within this, general
insurance income increased by 7 per cent and private
client income by 18 per cent. Life, pension and
investment income increased by US$56 million, or
16 per cent, of which US$15 million was the benefit
of a reduction in the discount rate, used to calculate
the net present value of future earnings inherent in
policies in force, from 12.5 per cent to 11.5 per cent.
Global safe custody fee income increased by 36 per
cent compared with 1999, benefiting from high
transaction volumes in 2000, the acquisition of new
customers and growth in assets under custody.
Higher fee and other income was also generated by
growth in personal current account and overdraft
fees, increased card income and higher corporate
banking fee income, mainly due to HSBC Bank plc’s
involvement in a buoyant mergers and acquisitions
market.
In Treasury and Capital Markets, other operating
income was US$386 million, 61 per cent higher than
1999. Foreign exchange income increased by 45 per
cent reflecting higher volumes, particularly in respect
of customer activities. Much of this was realised
from an increase in business in the regional treasury
centres, where income increased by 40 per cent.
Fixed income results also improved notably in gilts
and derivatives activity, linking with an increase in
debt origination. The currency options business also
expanded during 2000 with an increased presence in
the euro zone following the absorption of RNYC’s
trading activities.
In Investment Banking, there were higher equity
commissions reflecting increased global equity
volumes. Fee income also rose, reflecting growth in
Corporate Finance where business transacted with
HSBC's corporate client base increased significantly.
Operating expenses, excluding goodwill
amortisation, were US$1,073 million, or 20 per cent,
higher than in 1999 of which some US$947 million
was due to the recent acquisitions.
In UK Banking, operating expenses increased by
US$258 million, or 8 per cent, to US$3,510 million
and the cost:income ratio remained at 56.4 per cent.
Staff costs increased by US$127 million, or 7 per
cent, to US$1,935 million, reflecting growth in staff
numbers to support growth in the wealth
management business and increased business
volumes, in addition to the effect of annual pay
increases and incentive costs. Additional IT staff
have supported development projects integral to the
continued improvement in customer service,